Three Critical Findings Revealing Fundamental Market Transformation
1. Abnormal Surge in Shipping Costs Reshapes Price Structure
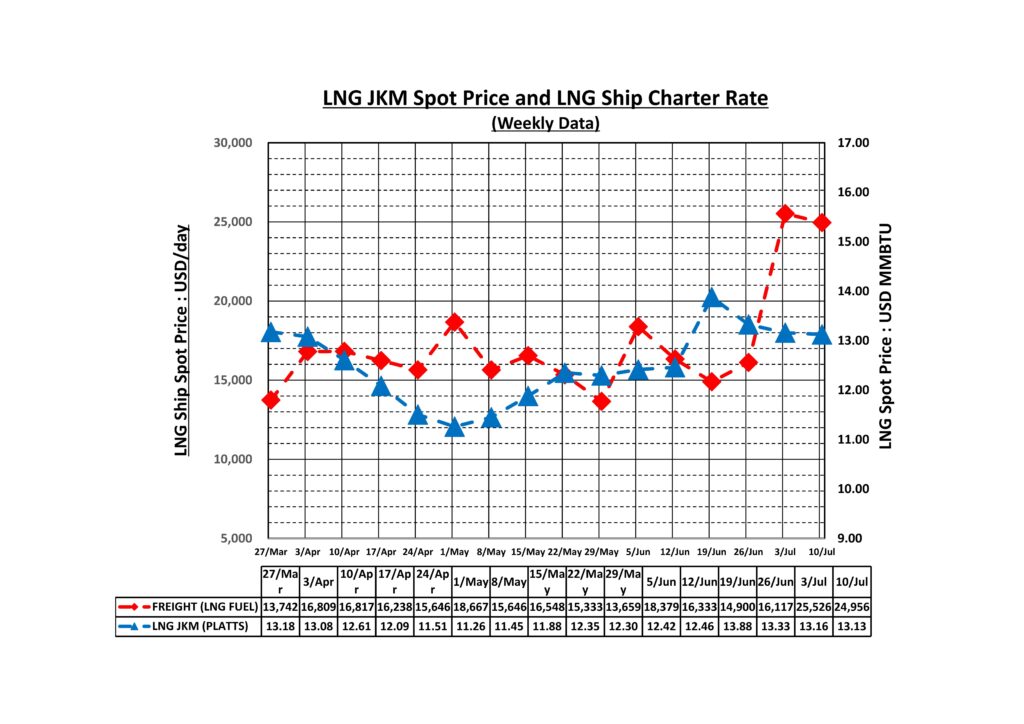
The most significant change over these four weeks was the extraordinary 67.49% surge in LNG vessel charter rates. The week of July 3rd witnessed an unprecedented spike from 16,117 USD/day to 25,526 USD/day, representing an increase of over 10,000 USD/day.
Converting this surge into transportation capacity and duration yields an upward pressure on LNG prices of approximately 2.4 USD/MMBTU. This closely matches the actual JKM price increase from the period low of 11.26 to the current 13.13, numerically demonstrating that transportation costs are directly supporting price levels.
Regional Disparity and Basic Price Correlation Analysis
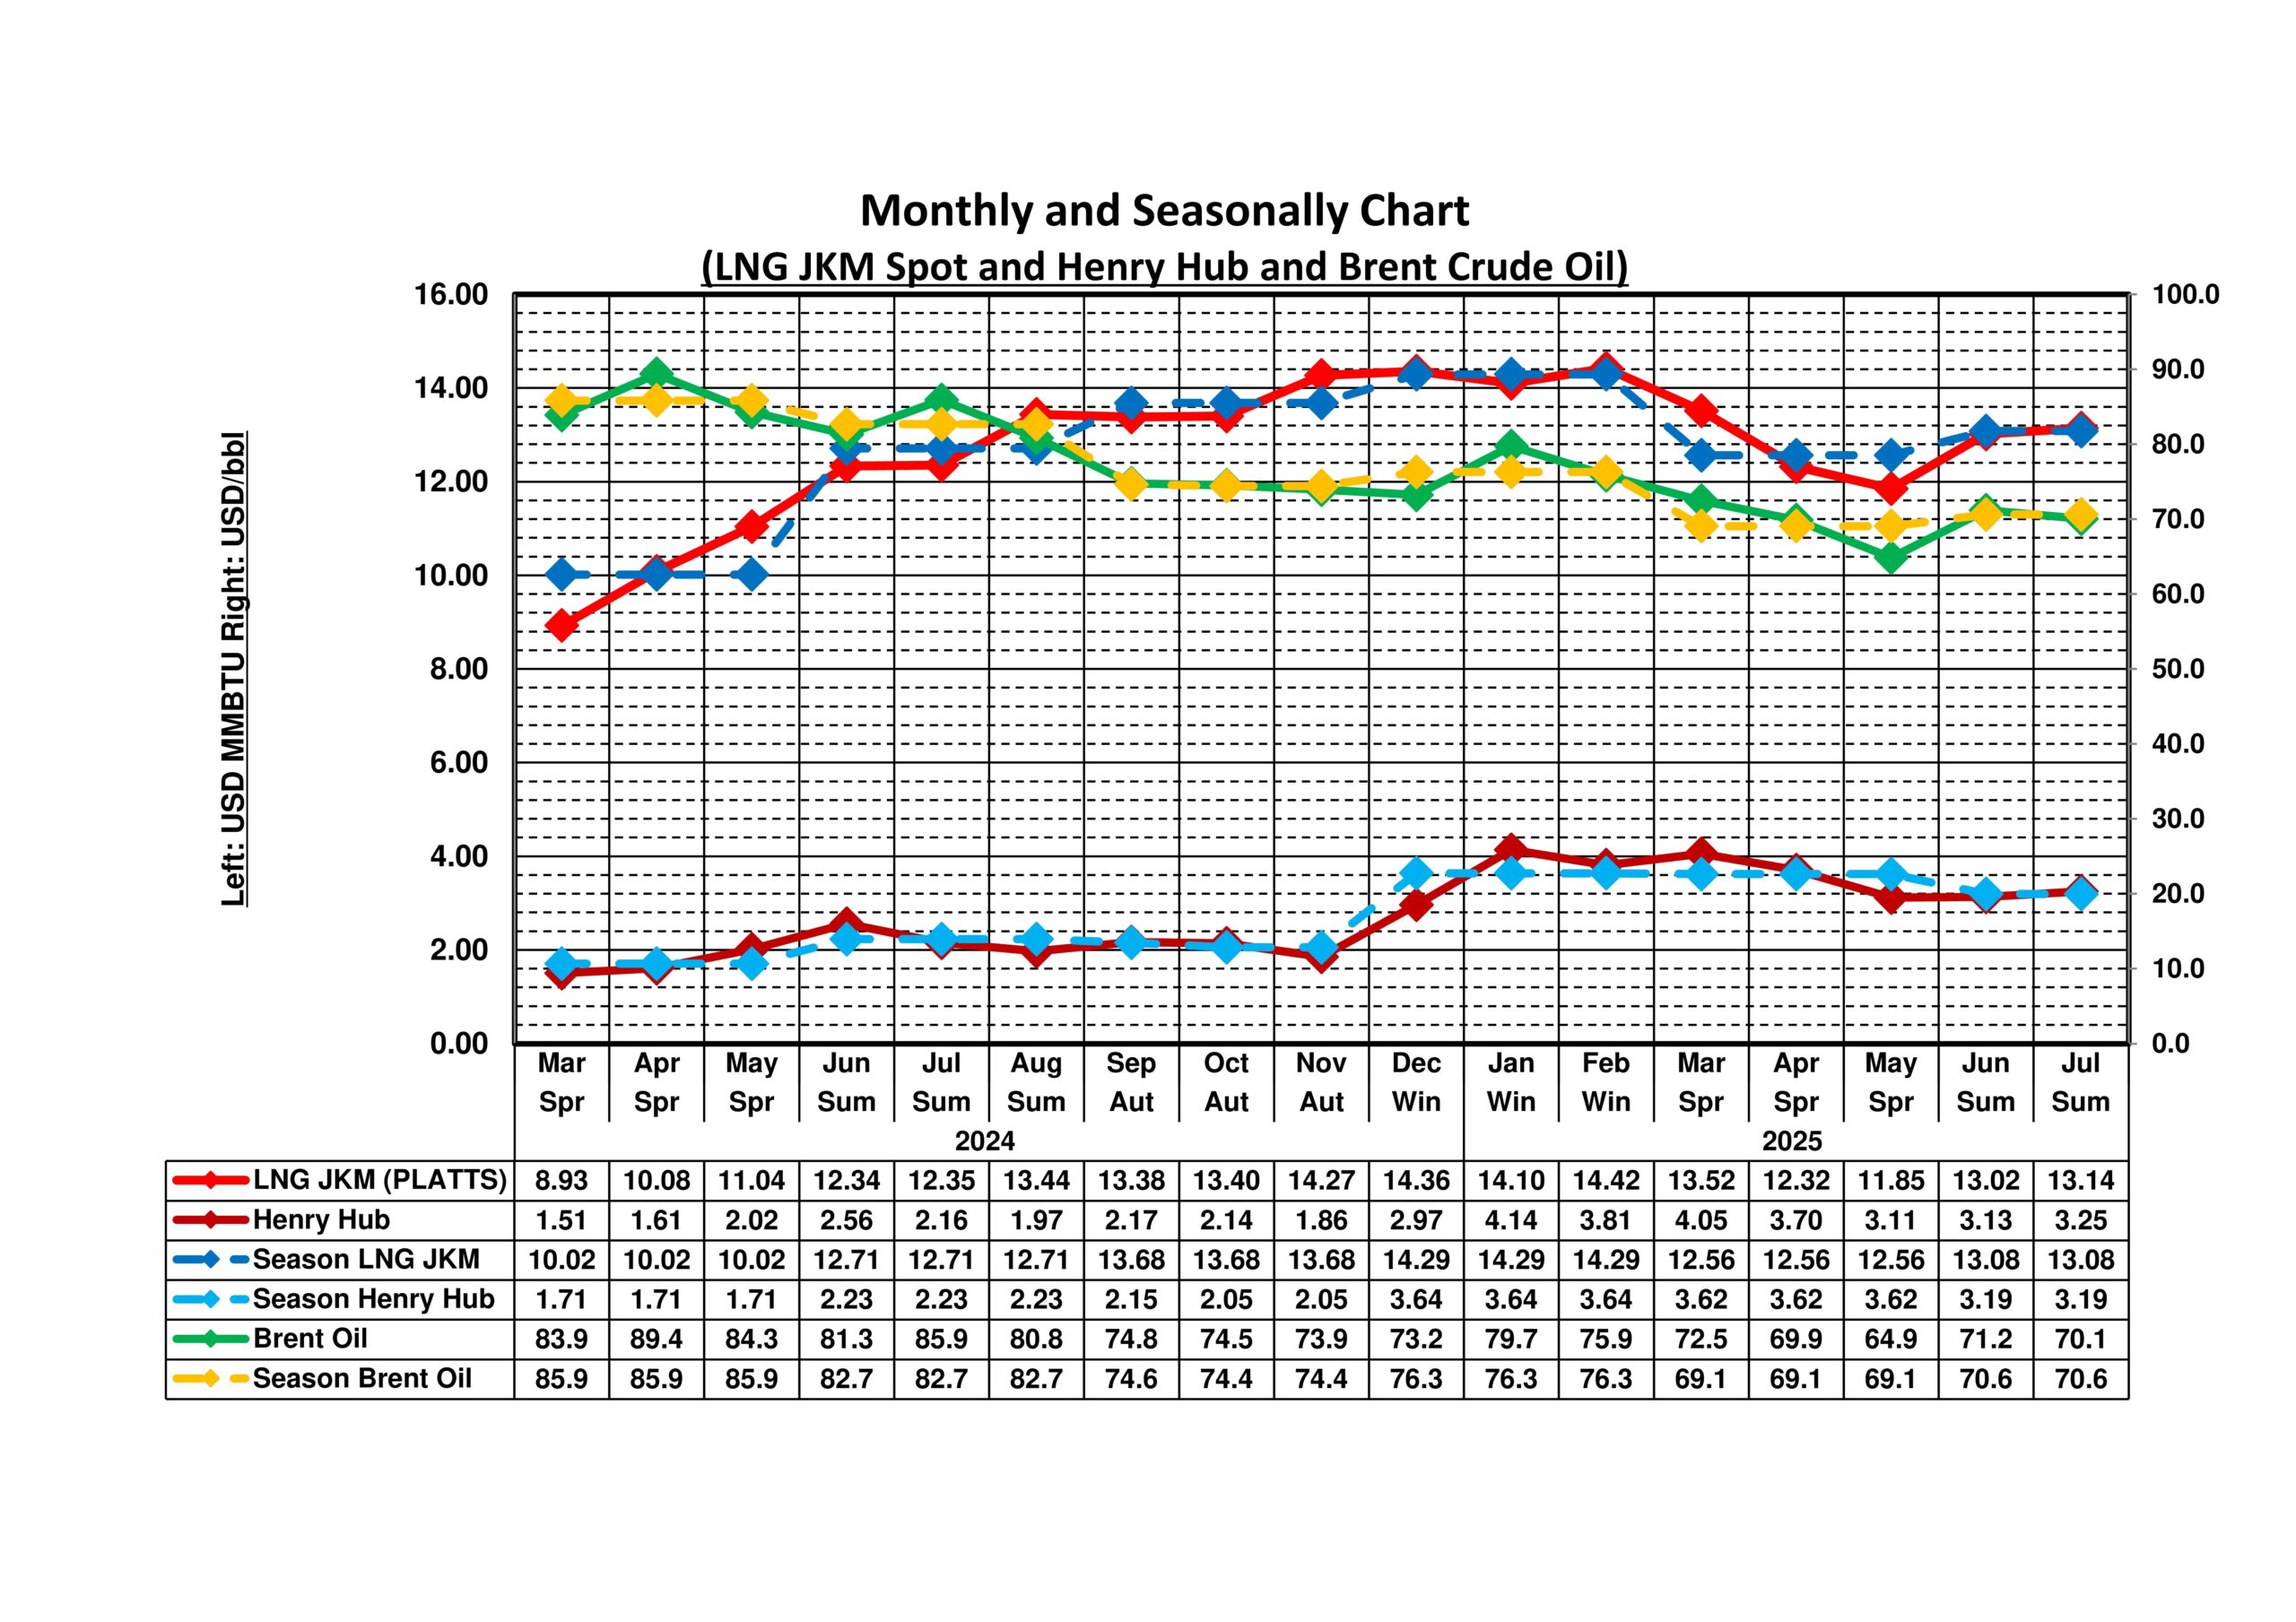
Monthly and Seasonal LNG JKM, Henry Hub, Brent Chart. This chart serves as an integrated tool for comprehensively analysing regional disparities and seasonal patterns in the global energy market. Henry Hub (HH) is the benchmark price for the North American natural gas market, based on pricing at the natural gas trading hub in Louisiana, and functions as a crucial indicator for assessing America’s LNG export competitiveness. The purpose of this chart is to compare three major indicators – JKM (Asia), Henry Hub (North America), and Brent (international crude oil) – on a monthly and seasonal basis, analysing regional price differentials and the impact of seasonal factors. It enables the identification of price differential patterns between the summer (June-August) and winter (December-February) seasons, quantifying how regional demand characteristics (such as Asia’s summer cooling demand and North America’s winter heating demand) influence price formation. Additionally, it serves as a benchmark for identifying regional arbitrage opportunities and predicting changes in LNG trade flows, supporting strategic procurement and investment decisions by distinguishing between long-term market trends and short-term seasonal variations.
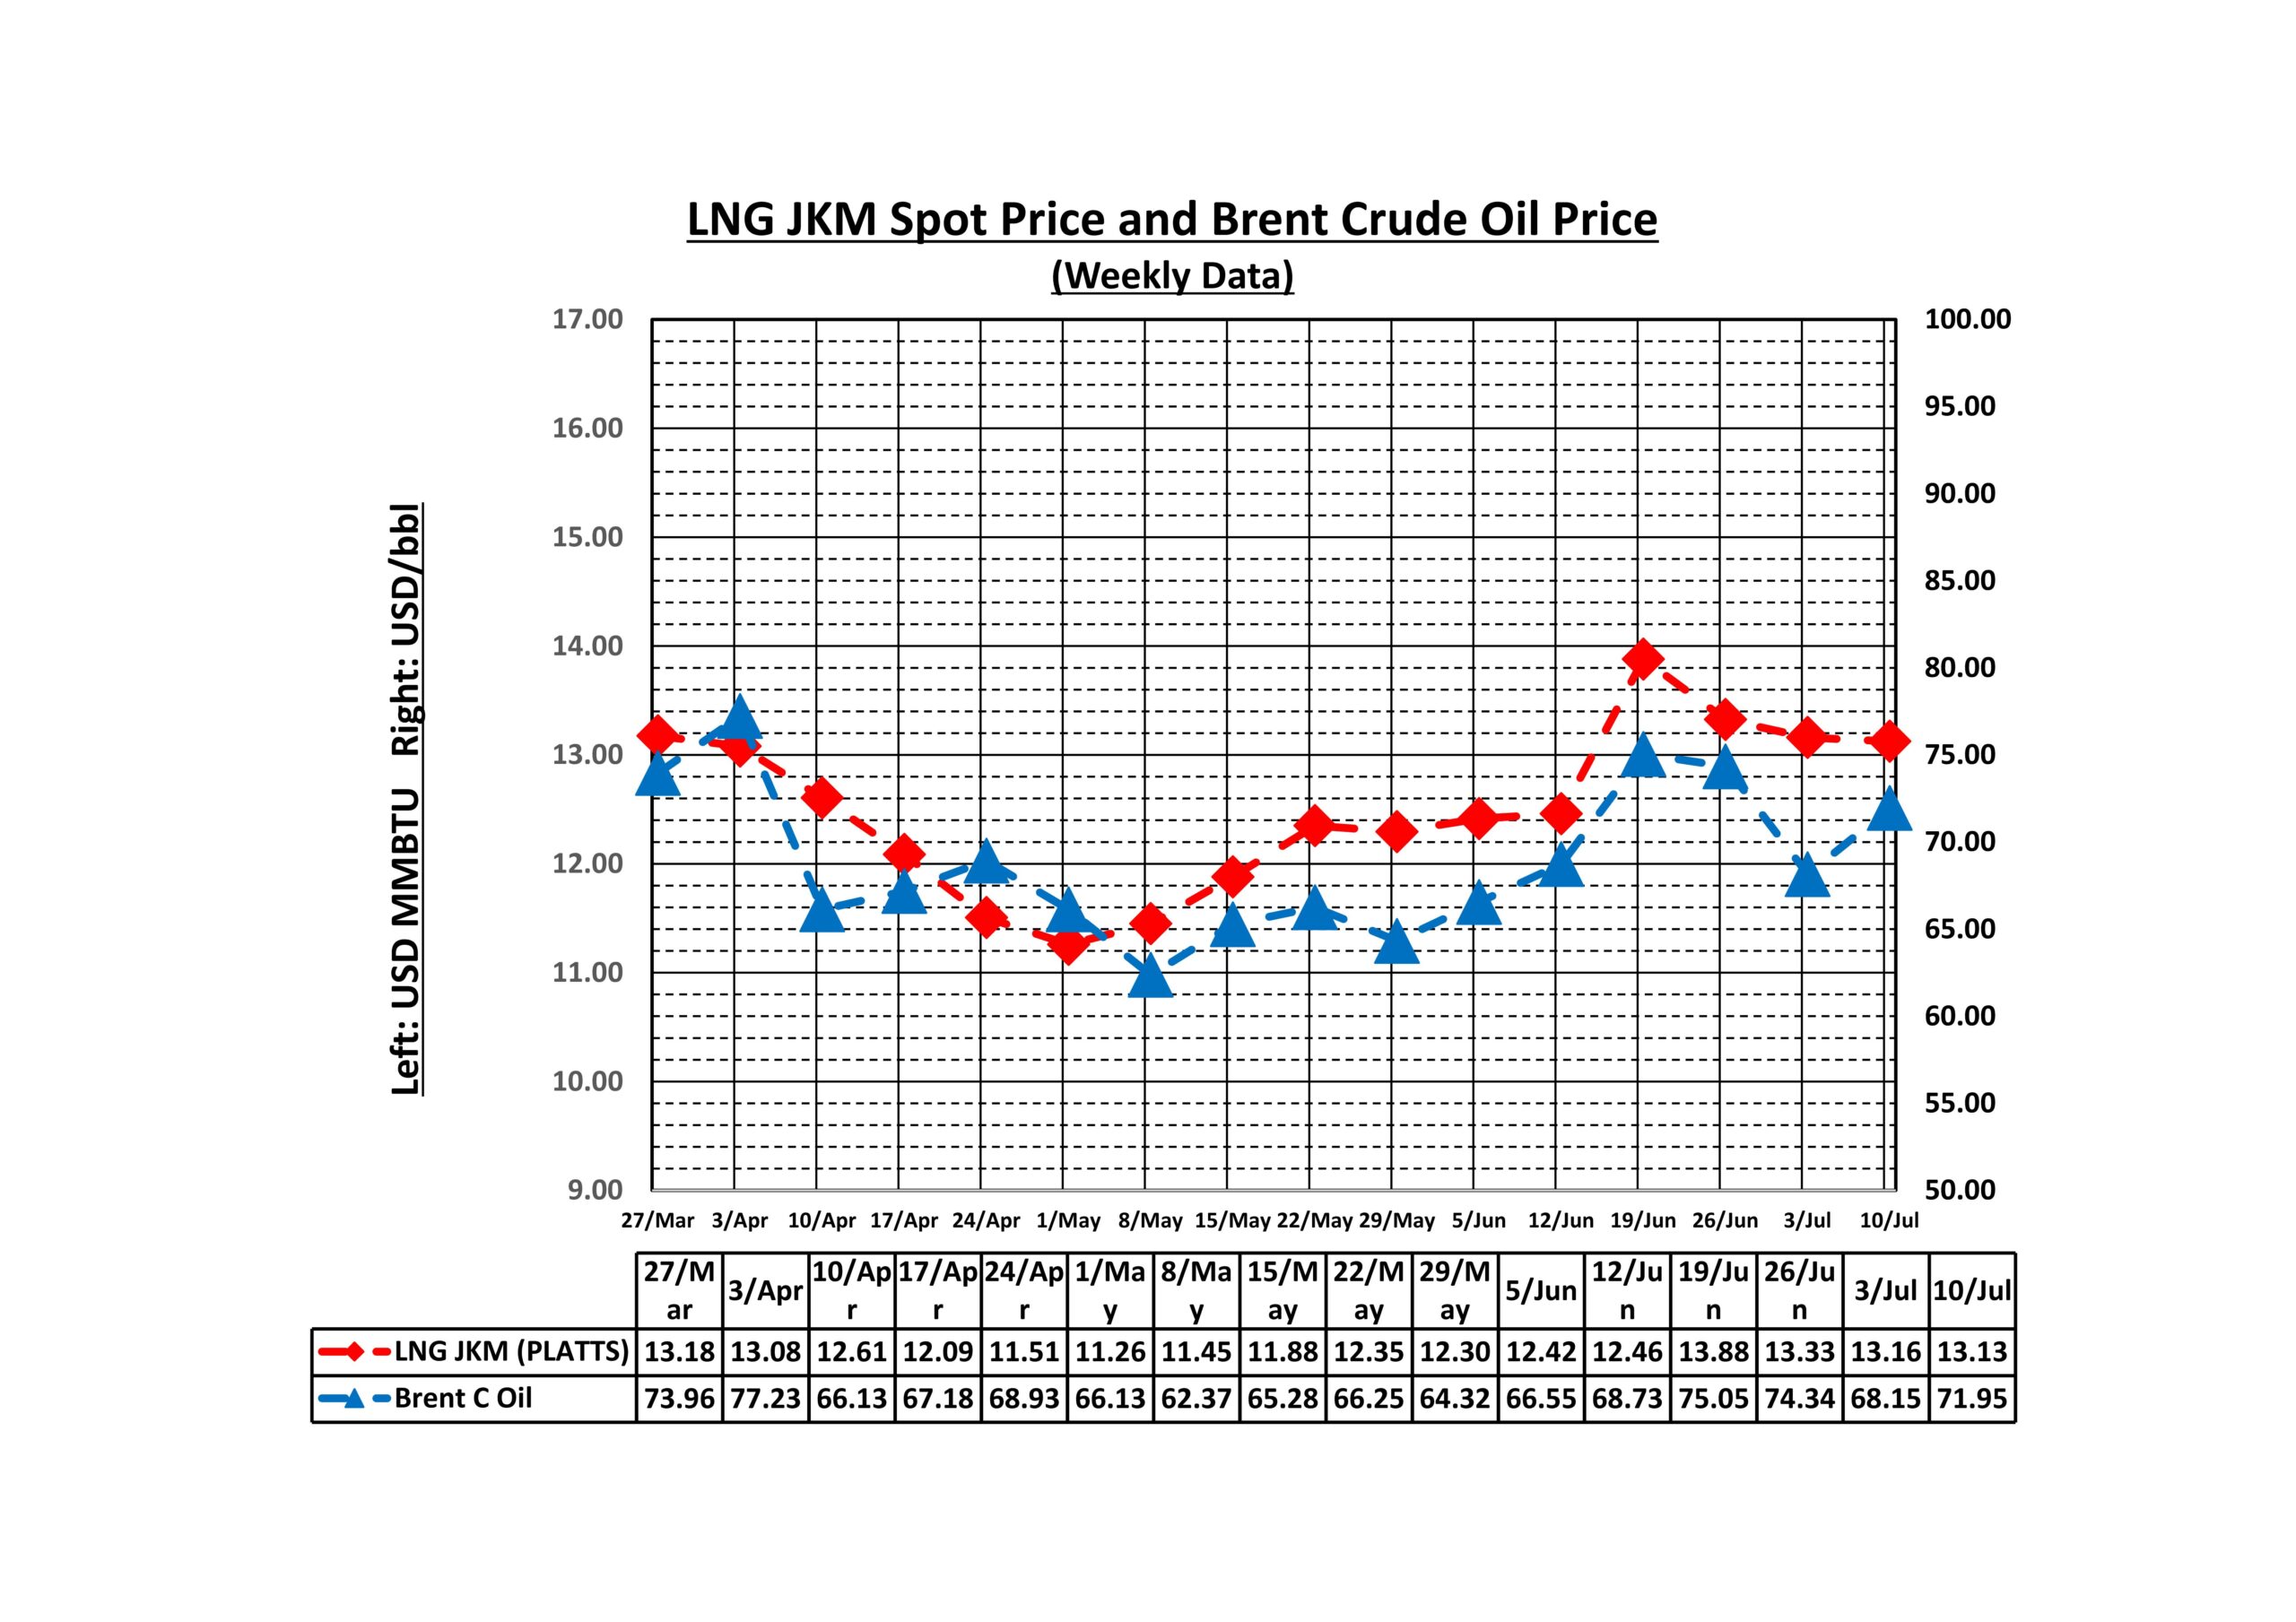
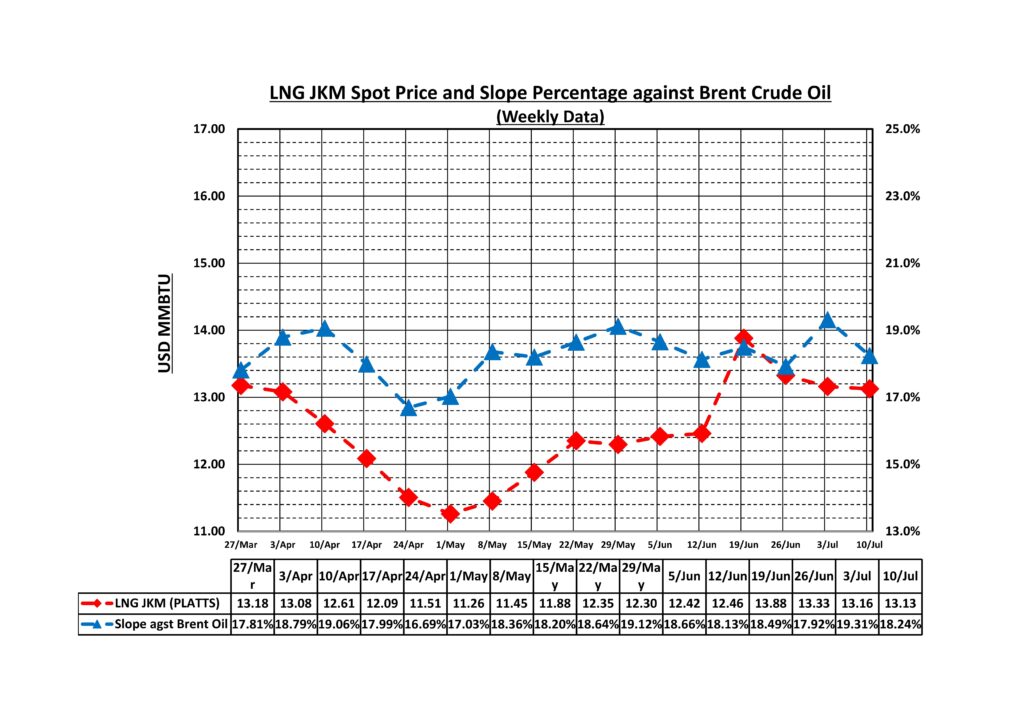
Weekly JKM LNG Spot and Brent Crude Oil Price Chart. This chart represents a core tool for analysing the fundamental price discovery function of the LNG market. JKM (Japan Korea Marker) serves as the representative indicator for LNG spot prices in the Asia-Pacific region, reflecting the supply-demand balance of major consuming countries, including Japan, Korea, China, and Taiwan, while performing the price discovery function for the world’s largest LNG consumption region. Meanwhile, Brent crude oil is an international crude oil price indicator based on North Sea crude oil, where the oil-linked pricing mechanism tied to Brent crude oil prices was mainstream in conventional LNG long-term contracts. The purpose of this chart is to track the correlation between JKM prices and Brent crude oil prices on a weekly basis, thereby verifying the validity of conventional oil-linked contracts. When the correlation coefficient between the two indicators is 0.8 or higher, it indicates a strong correlation; when it is 0.5 or lower, it suggests a high degree of independence. It enables analysis of which price functions as a leading indicator during geopolitical risks or Asia-specific demand fluctuations. This serves as a benchmark for identifying when the LNG market developed independent price formation mechanisms from the oil market and detecting structural market changes.
2. “Abnormal Price Stability” During Geopolitical Crisis
Despite significant military conflicts in the Middle East, JKM price volatility remained confined to an extremely narrow range of 11.26-13.88 USD/MMBTU, with a standard deviation of only 0.75. The coefficient of variation of 0.06 indicates characteristics of a mature commodity market.
Comparatively, during the early stages of the Ukraine war in 2022, JKM prices fluctuated between 15-45 USD/MMBTU. The current stability is remarkable, demonstrating that the LNG market has developed the capacity to absorb external shocks through supply source diversification and contract flexibility.
3. Structural Transformation in Price Formation Mechanisms
The market has shifted from the traditional “supply-demand balance + oil price linkage” model to a more complex pricing mechanism that incorporates “transportation costs + geopolitical risk premiums + seasonal factors + inventory levels.”
Particularly noteworthy is the emergence of “downward price rigidity.” During a period when Brent crude fell 19.3%, JKM price decline was limited to 13.9%, finding support at 11.26 USD/MMBTU. This indicates that transportation cost increases have become a permanent price support mechanism.
Market Overheating and Relative Price Analysis
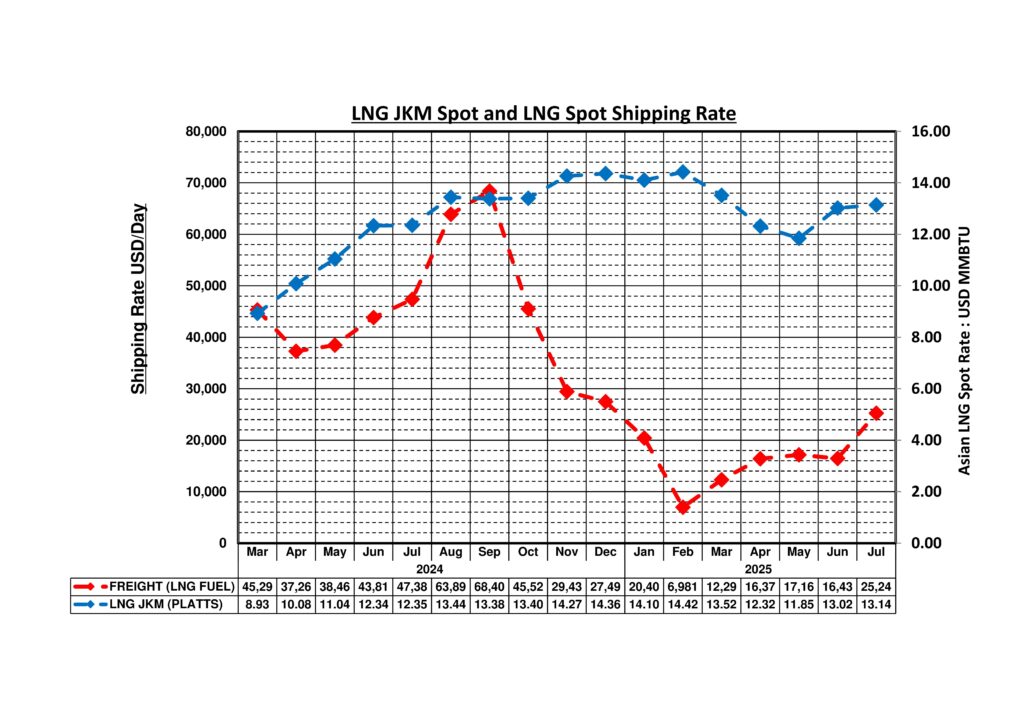
Monthly LNG JKM and LNG Shipping Rate Chart . This chart functions as a time-series analysis tool for evaluating long-term structural changes and seasonal patterns in the LNG market. Monthly-based analysis enables the capture of medium to long-term trends and seasonal changes that are invisible in weekly data. The purpose of this chart is to understand seasonal patterns of LNG prices and shipping rates throughout the year, identifying periods of abnormal price and cost increases. Typically, the LNG market exhibits seasonality, where prices rise during the summer (Asia’s cooling demand) and winter (heating demand) seasons, while falling during the spring and autumn shoulder seasons. Deviations from this pattern serve as signals indicating structural market changes or supply constraints, providing important criteria for distinguishing between temporary supply-demand imbalances and structural market shifts. Additionally, by analysing annual patterns in vessel charter rates, it enables an understanding of changes in the LNG transportation market’s supply-demand balance and can be utilised for future logistics cost forecasting.
Weekly JKM LNG Price and Slope Percentage Chart. This chart serves as an important analytical tool for evaluating the relatively appropriate level of LNG prices. The slope represents the ratio of JKM price to Brent crude oil price, displayed as a percentage, and functions as a relative value indicator, showing the level of LNG prices compared to crude oil prices. The purpose of this chart is to precisely measure the relative premium or discount of JKM prices against Brent crude oil every week. Historically, slope ratios of 17-18% indicate an appropriate price range, while over 20% suggests that LNG is expensive relative to crude oil, and below 15% indicates undervaluation. The fluctuations in this ratio can be utilised for assessing LNG market overheating and optimising procurement timing, while rapid increases in slope ratios function as signals indicating demand tightening or LNG supply constraints in the Asian region. It provides crucial data directly connected to energy procurement strategies, serving as a judgment indicator for long-term contract price revision negotiations and new contract conclusion timing. This data detects structural market changes that are invisible in absolute prices by capturing relative price movements.
Strategic Adaptation by Market Participants
Supply-Side Strategic Shift Major suppliers have pivoted from short-term price optimisation to long-term market share preservation strategies. This reflects strategic calculations aimed at avoiding demand destruction through the adoption of alternative energy, triggered by rapid price increases.
Enhanced Demand-Side Adaptability: Major consuming nations have improved their resilience to supply disruptions and price volatility through diversification of supply sources, advanced inventory management, and enhanced demand elasticity. This has reduced panic buying behaviours and suppressed extreme price volatility.
Future Market Outlook
Short-term market dynamics suggest that transportation costs are likely to remain elevated, continuing to function as a price support mechanism for JKM prices. The limited prospects for rapid resolution of geopolitical risks, combined with ongoing reassessment of underwriting risks in the marine insurance market, support this outlook.
Structural Changes The LNG market has entered a new phase of “normalised risk premiums,” where market participants increasingly view risks as structural rather than episodic factors. This represents a fundamental shift that requires revising traditional price forecasting models.
Formation of New Price Ranges A new price equilibrium is emerging, balancing upward pressure from transportation costs against downward pressure from supply abundance. This equilibrium point is likely to stabilise at higher levels than historical norms, indicating a fundamental shift in LNG market pricing structure.
Conclusion
The four-week data reveals that the LNG market is experiencing not merely price volatility, but a fundamental transformation in price formation mechanisms themselves. The surge in transportation costs, normalisation of geopolitical risks, and emergence of downward price rigidity are all interconnected manifestations of structural change. Future LNG market analysis will require analytical frameworks that incorporate these new factors.
This transformation signifies the LNG market’s evolution into a more sophisticated and resilient system, capable of absorbing various risk factors while maintaining relative stability. However, it also introduces new challenges in the form of structural price rigidity and permanent risk premiums that must be factored into long-term market strategies.
Medium-to-Long Term Trends and Physical Constraint Analysis
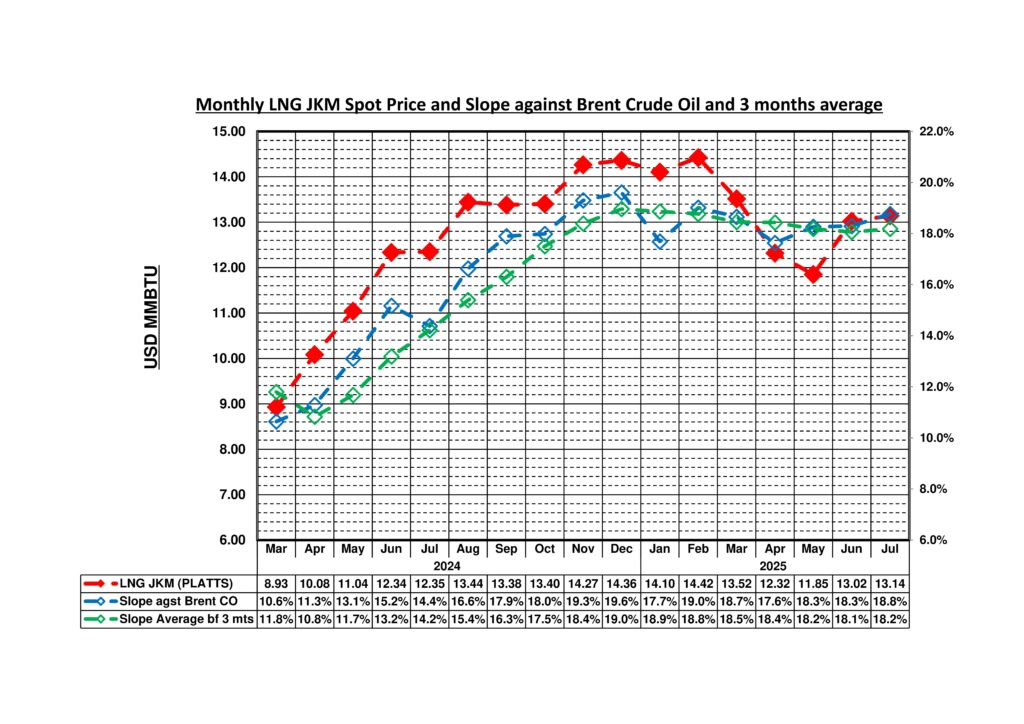
Monthly JKM LNG Price and Slope Average Chart. This chart serves as a smoothed analytical tool for evaluating the medium- to long-term price appropriateness in the LNG market. Using 3-month moving averages removes short-term price fluctuations and noise, enabling understanding of the market’s underlying trends. The purpose of this chart is to display three-month moving averages of JKM prices and slope ratios against Brent crude oil, providing medium- to long-term premium/discount judgments that are not influenced by short-term fluctuations. Data smoothed by moving averages provides more reliable judgment criteria for investment decisions and long-term contract price revision negotiations. Particularly, when slope ratio moving averages show sustained increases or decreases, they function as a signal indicating structural market changes, enabling analysis that distinguishes them from temporary price fluctuations. This chart serves as a key reference indicator for assessing the market’s underlying direction in the formulation of energy procurement strategies and long-term investment planning.
Weekly JKM LNG Price and LNG Shipping Rate Chart . This chart serves as a practical analytical tool for evaluating physical constraints and the balance between supply and demand in the LNG market. LNG Shipping Rates (vessel charter rates) indicate the daily charter costs for LNG transport vessels, serving as an important indicator of physical tightness in the LNG market. Rapid increases in vessel charter rates indicate increased LNG transportation demand or vessel supply constraints, functioning as leading indicators for judging market overheating. The purpose of this chart is to analyse in detail the relationship between LNG prices and transportation costs every week, thereby understanding the market’s proper supply-demand balance. Typically, JKM prices and vessel charter rates maintain a positive correlation; however, divergence between the two serves as a signal indicating structural market changes or temporary supply constraints. Particularly during periods of geopolitical risk or seasonal demand fluctuations, it enables the quantitative analysis of how transportation cost increases affect LNG prices, serving as a benchmark for evaluating the impact of physical supply constraints on price formation.
Leave a Reply