Key Takeaways
- JKM prices declined 18% from mid-June highs to $11.44/MMBtu
- China’s LNG imports down 22% year-to-date
- Shipping rates spiked due to Red Sea route diversions
- Global LNG supply expansion outpaces demand growth
Market Overview: Summer 2025 Adjustment Phase
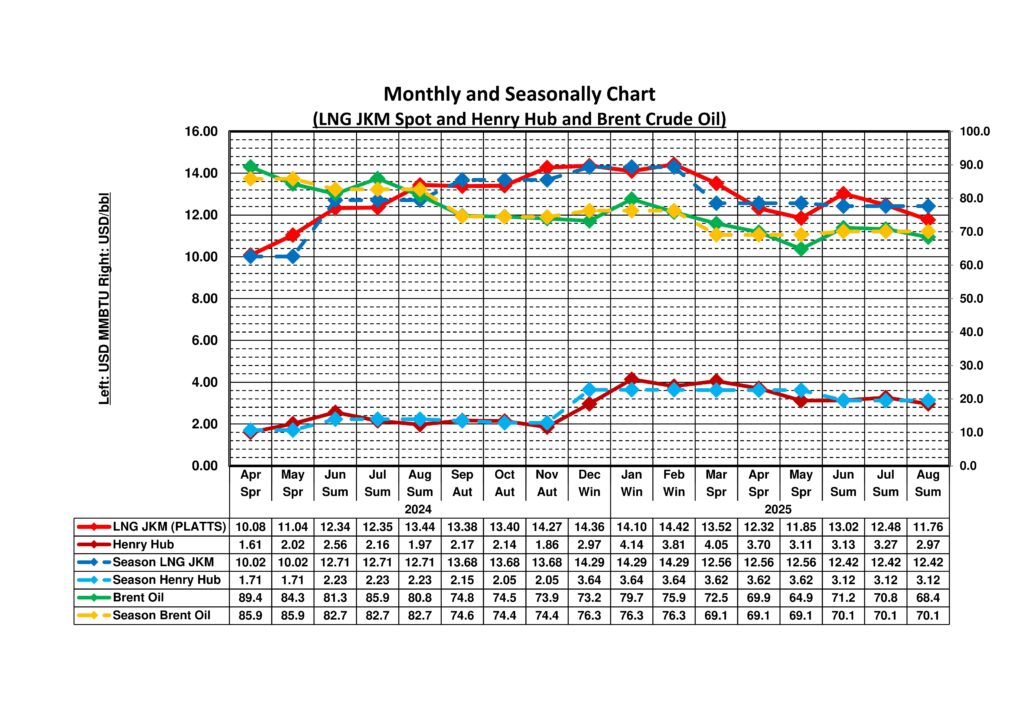
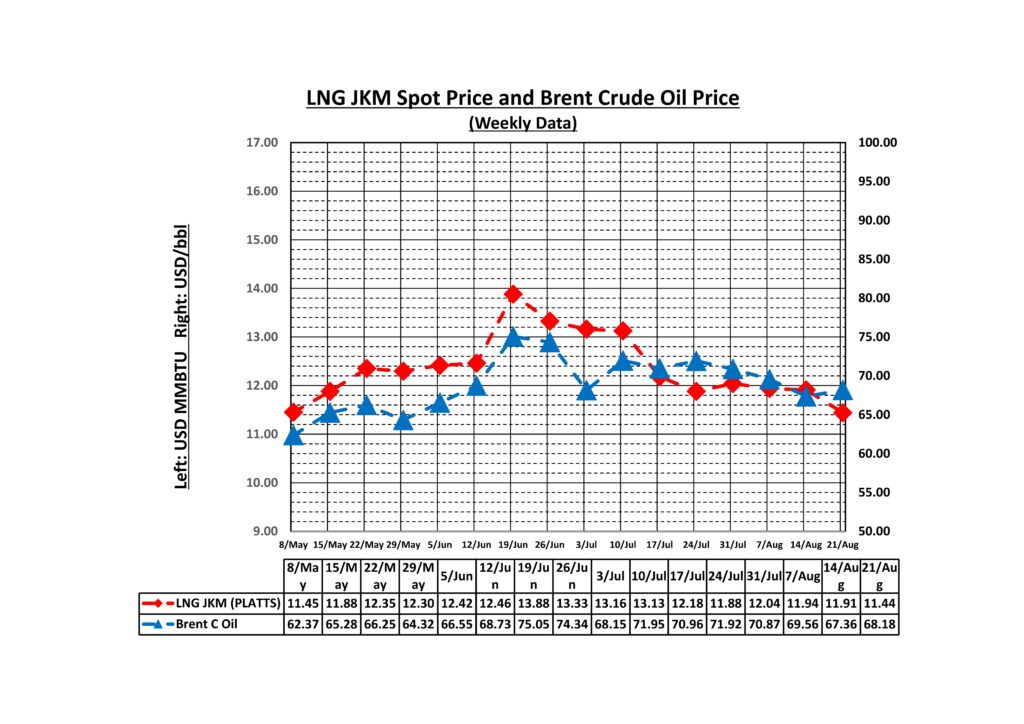
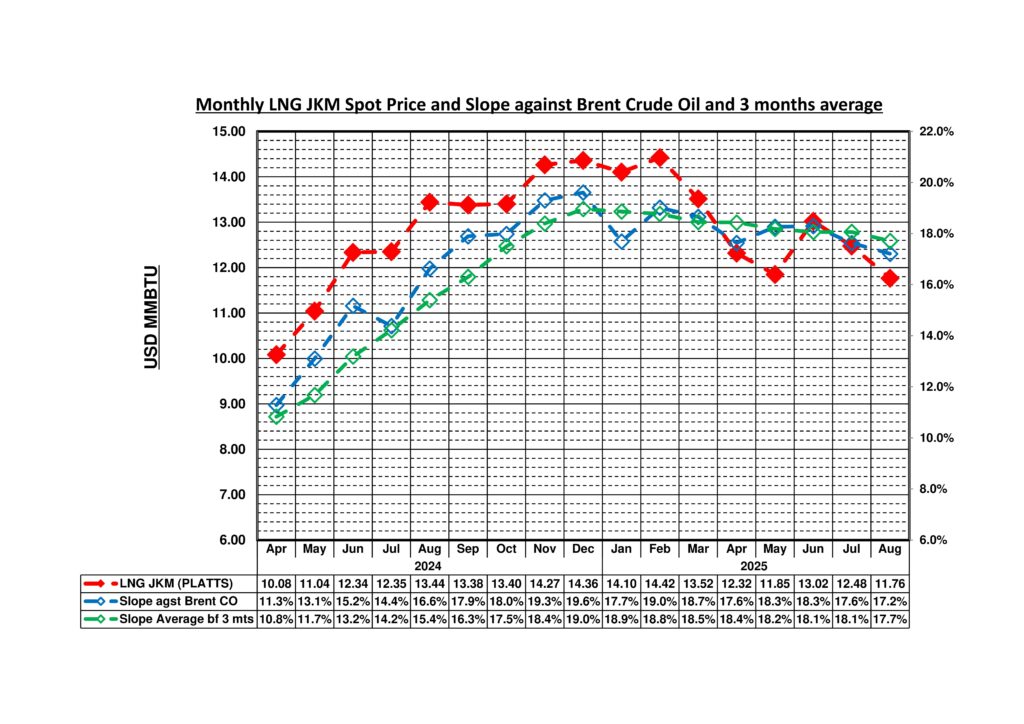
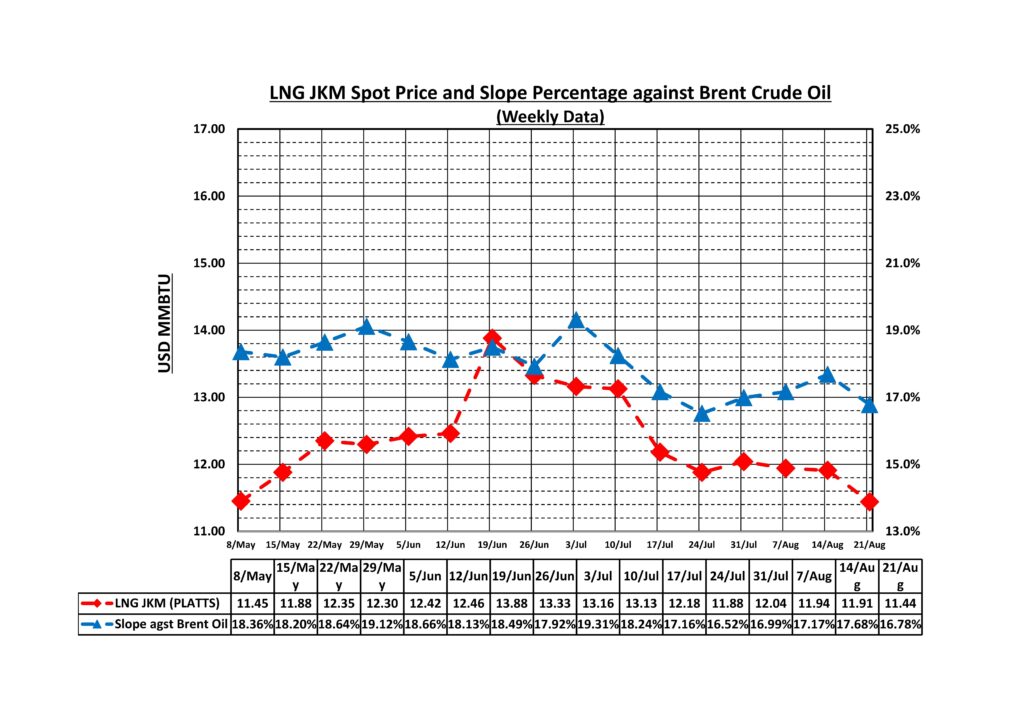
The LNG market in summer 2025 is in an adjustment phase. JKM prices recorded highs in the mid-$14/MMBtu range in mid-June before declining approximately 18% to $11.44/MMBtu by the end of August. This price movement reflects a return to price levels that reflect the fundamentals of supply and demand, following temporary increases driven by geopolitical factors.
Brent crude oil prices showed similar movements, declining from a peak of $75.05/bbl on June 26 to $68.18/bbl by the end of August. While the correlation between the two commodities has been maintained, LNG’s slope ratio against Brent crude has fluctuated within a range of 16.78% to 19.31%, indicating an overall adjustment in energy prices.
Geopolitical Factors Driving Shipping Rate Volatility
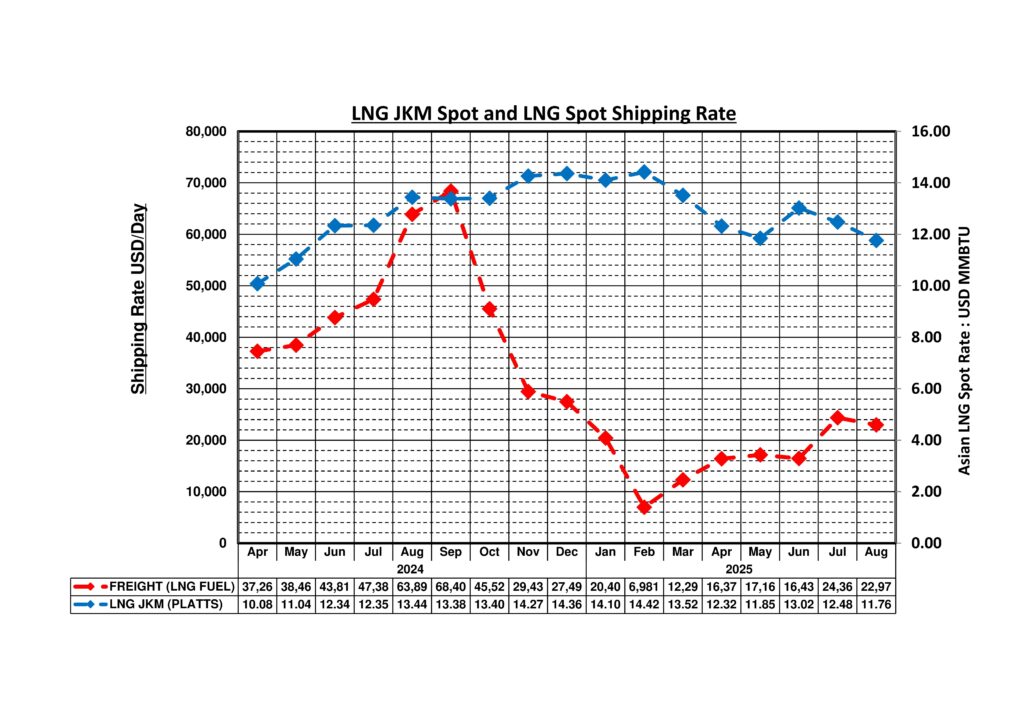
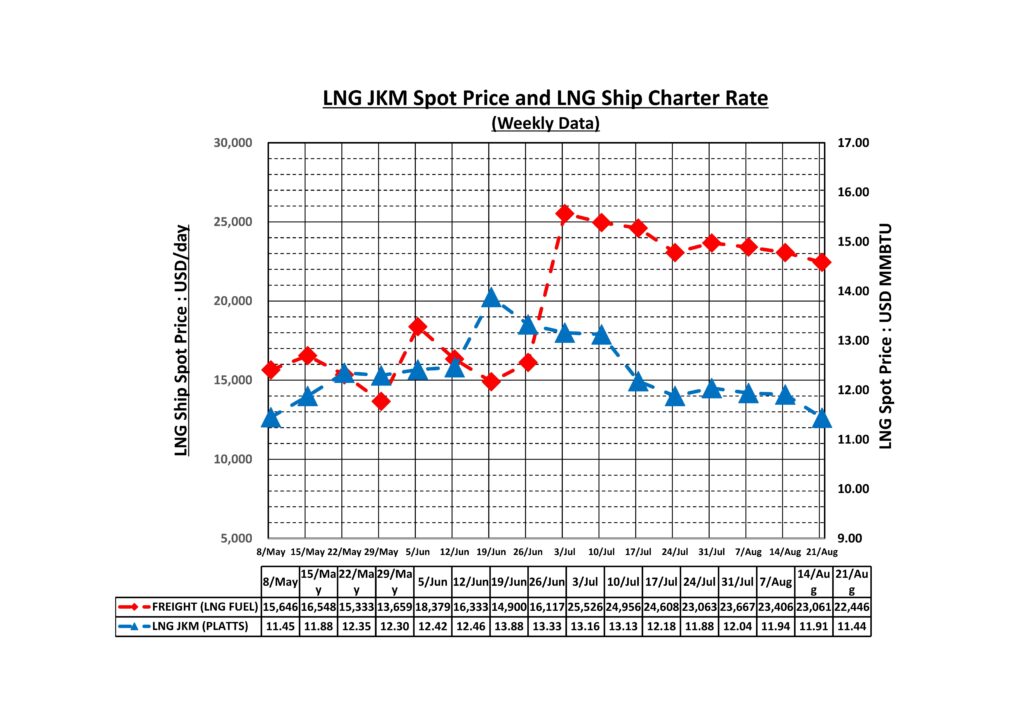
The sharp increase in LNG shipping rates was primarily caused by the avoidance of the Red Sea and Suez Canal routes. Following Houthi attacks on commercial vessels (over 190 attacks by October 2024) since November 2023, traditional Middle East-Europe-Asia routes via the Suez Canal became difficult to use. Consequently, LNG vessels were forced to take detour routes around the Cape of Good Hope, the southernmost tip of Africa.
This route change resulted in approximately 20% longer sailing distances from the Middle East to Asia, with significantly increased transit times. Furthermore, the detours increased fuel costs required for transport, pushing up overall transportation costs. Combined with reduced vessel availability during the summer maintenance period, the tightening of the vessel supply-demand balance resulted in a sharp spike in freight rates in July.
However, LNG prices themselves did not show as volatile movements as freight rates. This was underpinned by strengthened energy security systems in Europe. European gas storage levels exceeded 70% in early August and reached 75% by the end of the month. Compared to the Russia-Ukraine crisis in 2022, Europe has secured sufficient inventory and diversified supply sources, significantly improving its resilience to geopolitical shocks.
China’s Structural LNG Demand Decline
The most notable change is the decline in LNG demand in Asian markets. China’s LNG imports are forecast to decrease 6-11% year-on-year for the full year 2025, with an actual 22% decline in the first eight months of the year.
This decline in demand has multiple underlying factors. First, the slowdown in Chinese economic growth has led to a decrease in energy demand in the industrial sector. Second, the rapid deployment of renewable energy is progressing. Electric commercial vehicle sales surged 191% year-on-year in the January-July 2025 period, accelerating electrification in the transportation sector and substituting traditional fossil fuel demand.
Henry Hub vs JKM Price Differential Analysis
The price differential between JKM and Henry Hub maintains approximately a 4-fold level. While Henry Hub trades in the $2.76-2.98/MMBtu range, JKM maintains $11.76/MMBtu. This price differential allows North American LNG exports to Asia to maintain certain economic viability.
Due to increasing natural gas demand within the United States, the EIA forecasts Henry Hub prices to rise to an average of $3.67/MMBtu in 2025 and $4.41/MMBtu in 2026. Rising Henry Hub prices mean increased supply costs for North American LNG, potentially creating upward pressure on Asian LNG prices in the future.
Supply Factors Leading Price Formation
This summer’s trends clearly demonstrate that supply factors have a stronger influence than seasonal demand patterns. Natural gas demand growth in the Asia-Pacific region is expected to remain below 1% in 2025, the weakest growth rate since 2022. Despite global electricity demand increasing 3.3% in 2025, JKM prices declined approximately 18% from $13.88/MMBtu to $11.44/MMBtu during the July-August peak electricity demand period.
This is underpinned by overwhelming supply capacity expansion. In 2025, 49.5 million tonnes per year of new LNG supply capacity is scheduled to come online globally, representing record levels second only to the 51.8 million tonnes in 2009. Furthermore, approximately 295 bcm per year (equivalent to about 215 million tonnes) of new LNG export capacity is planned to be added during the 2025-2030 period, representing the largest supply capacity expansion wave in LNG market history.
On the demand side, China, Asia’s largest importer, saw LNG imports decline 22% in the first eight months, while Japan, the world’s second-largest importer, has seen LNG imports decline 20% since 2018. The reason prices showed a declining trend despite increased summer electricity demand is that supply expansion (49.5 million tonnes increase globally) significantly outpaced demand growth (Asia-Pacific <1%).
Supply-Driven Market Dynamics
In the short term, prices are expected to continue trading near current levels. While upside risks exist due to geopolitical factors, significant price increases are difficult given China’s substantial demand decline and supply capacity expansion.
Toward the winter demand season, seasonal price increases are anticipated, but these are likely to be restrained compared to traditional winter premiums. Given Europe’s sufficient inventory levels and demand decline in China, Asia’s largest importer, restocking demand is also expected to be limited.
In the medium term, global LNG oversupply will materialise in earnest by 2030. In this environment, competitively priced supply sources will expand their market share, while high-cost producers willface elimination. Particularly if China’s demand decline becomes structural, it could have long-term implications for LNG supply-demand balance across the entire Asia-Pacific region.
Conclusion: Buyer’s Market Emerges
The three-week analysis reveals a fundamental shift toward oversupply in global LNG markets, driven by massive capacity additions and structural demand changes in Asia’s largest importing nations.
Leave a Reply