
Analysis baseline: approximately March 5, 2026. Events after this date are not reflected.
Chapter Index
| Chapter | Title |
| Prologue | What Happened on February 28, 2026 |
| Ch. 1 | The Path from Nuclear Talks to Military Action and the Structure of Justification |
| Ch. 2 | How Past Limited Retaliation Enabled the Decision to Assassinate the Supreme Leader |
| Ch. 3 | The 58-Day Force Redeployment from Venezuela to Iran |
| Ch. 4 | Post-Assassination Power Structure Revealed by Persian-Language Primary Sources |
| Ch. 5 | The Military Meaning of Five Simultaneous Kills and the Reality of Successor Placement |
| Ch. 6 | Six-Stage Evaluation of the Intelligence Process That Made the Assassination Possible |
| Ch. 7 | Quantifying Iran’s Remaining Military Capability by Region and Domain |
| Ch. 8 | Verifying Wartime Fiscal Sustainability from Iran’s Actual Government Budget Figures |
| Ch. 9 | Verifying All of Iran’s Access Routes Beyond Hormuz with Actual Data |
| Ch. 10 | The CIA’s Pre-Assessment and Five Scenarios for ‘After the Destruction’ |
| Epilogue | What This Attack Designed, What It Achieved, and What It Has Not |
Chapter 9: Verifying All of Iran’s Access Routes by Actual Numbers
── A Complete Inventory of Iran’s External Access Modes by the Numbers
1. Beyond ‘If Hormuz Stops, It’s Bad’ — The Need for a Full-Mode Inventory
‘If the Strait of Hormuz stops, it’s bad’ — as Chapter 8 verified, this statement is correct. But the question beyond ‘bad’ is: does Iran have ‘roads to the outside’ other than Hormuz, and if so, how much volume can they carry? No media outlet has answered this with numbers.
Iran is not an island. To the north lies the Caspian Sea, to the south the Persian Gulf and Gulf of Oman, to the west Iraq and Turkey, to the east Afghanistan and Pakistan, to the north Azerbaijan and Turkmenistan. It connects to the outside world through five modes: maritime, road, rail, air, and pipeline. The question is how small these modes are compared to maritime, measured in actual numbers.
This chapter inventories all of Iran’s access modes by actual numbers. Ports 234.8M tons/year, containers 3.08M TEU, air cargo 390K tons, rail transit 5M+ tons, Mehran border 400 trucks/day — when these numbers are placed side by side, what emerges is the overwhelming scale of maritime and the quantitative impossibility of substitution by road or rail.
2. Full-Mode Summary Matrix — Five ‘Roads to the Outside’ at a Glance
Table 9-1: Iran’s Full Access Mode Summary Matrix
| Mode | Key Gate/Corridor | Access Volume (Peacetime) | Main Constraints | Partner Countries |
| Maritime (National) | North (Caspian) South (Persian Gulf / Gulf of Oman) | 234.8M tons/yr 3.08M TEU | Sanctions destabilise shipping/insurance/settlement. 90% depends on Hormuz transit. | Russia/Caspian states, Gulf states, China (crude), India (Chabahar) |
| Maritime (Container Hub) | Shahid Rajaee (Bandar Abbas) | 2.39M TEU >81M tons | 85-90% of containers concentrated. SPOF. Foreign trade $29B (~22%) [9-01]. | International routes |
| Maritime (Gulf of Oman) | Chabahar Port | 134,082 TEU 8.7M tons (cumulative since 2018) | Hinterland railway (Chabahar-Zahedan) incomplete. Sanctions risk. Current volume small [9-02]. | India (10-year operating contract) |
| Air | All airports | 391,889 tons/yr | International flights under sanctions/restrictions. Cannot substitute maritime volume [9-03]. | UAE hubs, neighbouring countries |
| Rail (Domestic) | Domestic trunk lines | 32,920M ton-km (2021) | Rasht-Astara incomplete; INSTC not fully functional as strategic corridor [9-04]. | INSTC (Russia/Azerbaijan/India) |
| Rail (Int’l Transit) | INSTC etc. | 5M+ tons/yr (2025 record) | Sanctions directly impact transit-country/shipper decisions. 2026 replication difficult [9-05]. | Central Asia, Russia, China |
| Road (vs Azerbaijan) | Astara / Bileh Savar | 350-400 trucks/day | Congestion, seasonal fluctuation, customs. Expansion agreement exists [9-06]. | Azerbaijan → Russia |
| Road (vs Iraq) | Mehran (Zurbatiyah) | 2.2M tons/11mo $1.2B, ~400 trucks/day | Border processing capacity, political conditions. Pilgrimage flows also heavy [9-07]. | Iraq |
| Road (vs Turkey) | Bazargan | (Volume unconfirmed, major border) | TIR green lane under discussion [9-08]. | Turkey |
| Crude (Terminal) | Kharg Island | 90% of crude via Kharg | Storage 28.3M bbl. Directly connected to Hormuz [9-09]. | China (main buyer) |
| Crude (Bypass) | Jask (Goreh-Jask Pipeline) | Design max 1M bpd Actual <70K bpd | Terminal still developing. Loadings ceased Sep 2024 [9-10]. | Hormuz bypass |
| Gas (Pipeline) | vs Turkey / vs Iraq | Turkey contract max 9.6 bcm/yr Iraq 7.8 bcm | Winter demand makes exports unstable. Turkey contract expires Jul 2026 [9-11]. | Turkey, Iraq |
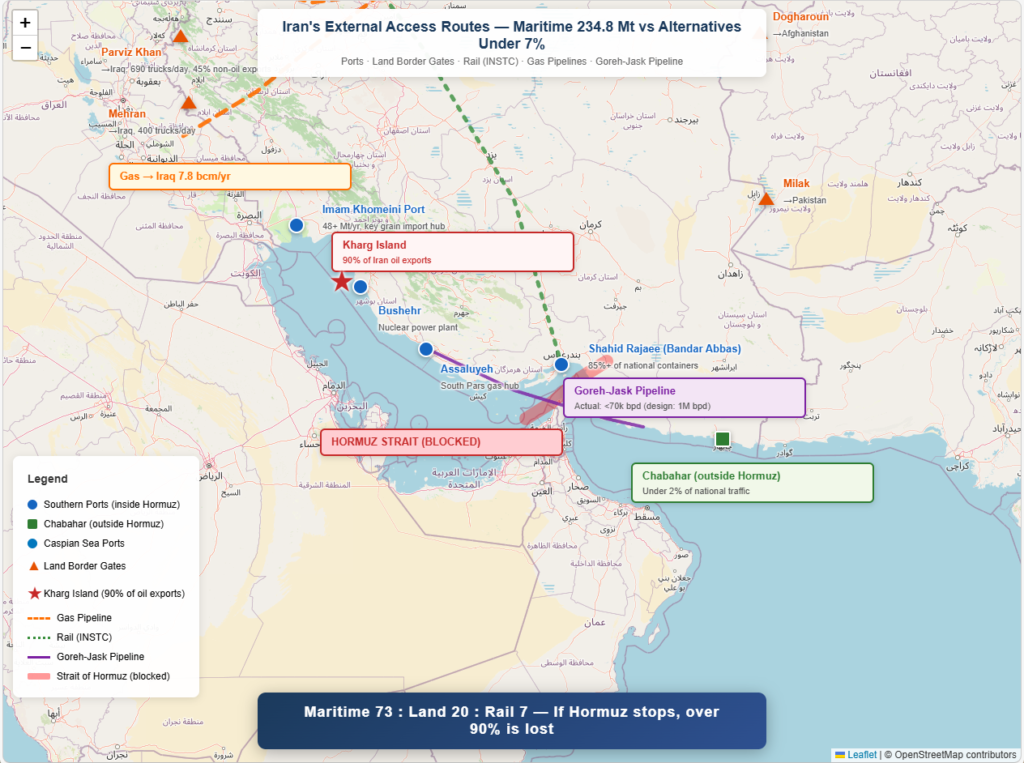
Figure 9-1: Iran’s Full Access Route Overview (Strait of Hormuz Area)
Source: Author. Map tiles: © OpenStreetMap contributors (ODbL). Port data: Iran PMO Annual Report. Road data: Tehran Times / IFP News / IRU. Gas pipelines: Tehran Times (Eurostat) / Columbia SIPA. Rail: Tehran Times. Goreh-Jask: BOE Report / NS Energy.
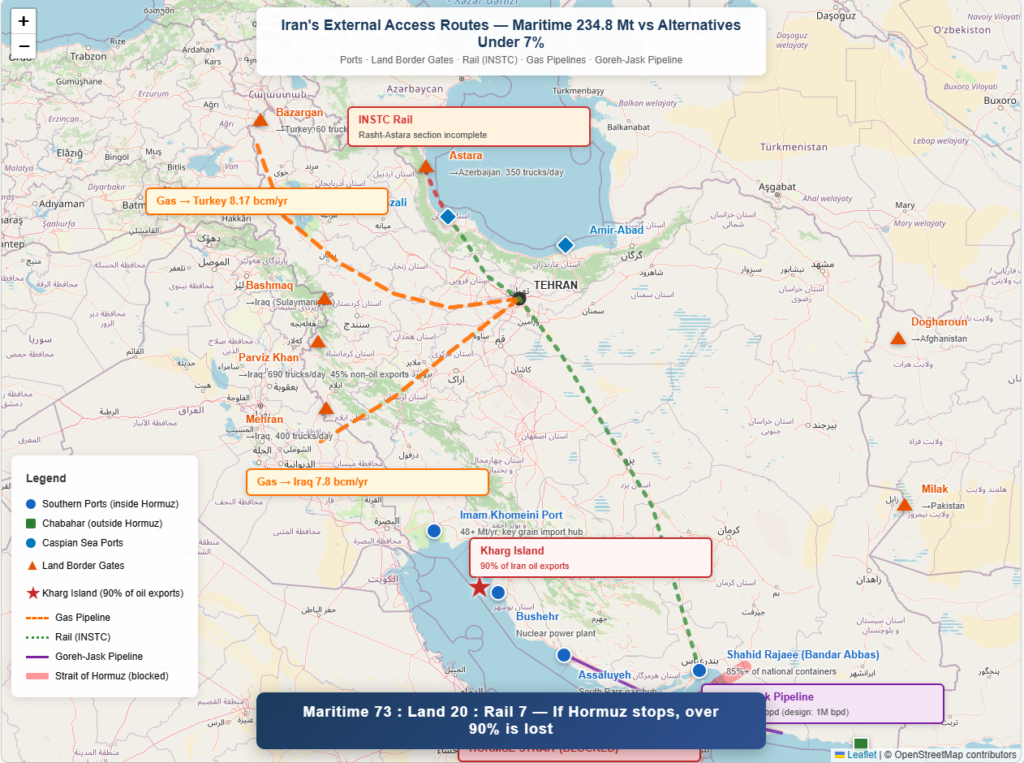
Figure 9-2: Iran’s Full Access Route Overview (Northern Region)
Source: Author. Map tiles: © OpenStreetMap contributors (ODbL). Port data: Iran PMO Annual Report. Road data: Tehran Times / IFP News / IRU. Gas pipelines: Tehran Times (Eurostat) / Columbia SIPA. Rail: Tehran Times.
3. Maritime Access — 234.8M Tons’ ‘Overwhelming Scale’ and Concentration Risk
Iran’s total port throughput is 234.8M tons/year (Iranian year 1403 ≈ 2024/3–2025/3), with containers at 3.08M TEU in 2024 [9-12]. Breakdown: loading 82.3M tons, unloading 152.5M tons; oil 103M tons, non-oil 132M tons. Without grasping this scale, comparisons with other modes are meaningless.
The problem is that this massive maritime logistics is concentrated in very few ports.
Table 9-2: Major Port Throughput and National Share — ‘Two Ports Over 55%’ Concentration
| Port | Throughput | National Share | Key Notes |
| Shahid Rajaee (Bandar Abbas) | >81M tons | >34.5% | Iran’s largest commercial port. 85-90% of containers, $29B in foreign trade (~22%) concentrated here [9-01]. 2024 containers: 2.39M TEU [9-13]. Located on Hormuz north shore. Past accident halted ‘57% of national nominal cargo capacity’ [9-14]. |
| Imam Khomeini (Khuzestan) | >48M tons | >20.4% | National supply lifeline. >15M tons/yr of essentials unloaded [9-15]. Strong food/medicine/basic materials import character. Deep inside Persian Gulf. |
| Bushehr | 6.5M tons | 2.8% | Southern supplementary port. Near Kharg Island crude loading. |
| Amir-Abad (Caspian) | 5.04M tons | 2.1% | Northern gateway. Referenced for CIS exports [9-16]. INSTC maritime leg starting point. |
| Chabahar (Gulf of Oman) | 4.15M tons | 1.8% | Expected as ‘Hormuz bypass alternative’ but current volume <2% nationally [9-02]. Hinterland railway incomplete. |
The top 2 ports (Shahid Rajaee and Imam Khomeini) alone account for over 55% nationally. Both face the Persian Gulf and require Hormuz Strait transit to access open sea. Over 55% of Iran’s maritime logistics depends on Hormuz, and that Hormuz has collapsed from 37 vessels/day to zero — this is the physical underpinning of Chapter 8’s ‘tap shutoff.’
4. Chabahar — The Reality of the ‘Hormuz Bypass Trump Card’
Chabahar port (Shahid Beheshti terminal) sits on the Gulf of Oman side and is Iran’s only major port with open-ocean access without transiting Hormuz. India has signed a 10-year operating contract with an investment framework ($120M + $250M equivalent) [9-02].
But the numbers are unforgiving. Per India’s MEA parliamentary response, cumulative throughput since 2018 is 134,082 TEU and 8.7M tons [9-02]. This is a 6-year cumulative figure; annualized, approximately 1.5M tons/year and ~22,000 TEU/year. Compared to Shahid Rajaee’s annual 81M tons and 2.39M TEU, Chabahar’s throughput is under 2% of Shahid Rajaee’s. The primary constraint: the Chabahar-Zahedan hinterland railway is incomplete [9-17]. The ‘Hormuz bypass trump card’ is attractive on the map but, by the numbers, far from a substitute.
5. Road Border Gates — The Reality of Mehran 400/day, Astara 350-400/day
Table 9-3: Major Road Border Gate Throughput — Comparison with Maritime
| Border Gate | Throughput | Partner | Key Notes |
| Mehran (vs Iraq) | 2.2M tons/11mo ~400 trucks/day, $1.2B | Iraq (Zurbatiyah) | Iran’s largest Iraq border. Pilgrimage flows also heavy. Annualized ~2.4M tons [9-07]. |
| Astara (vs Azerbaijan) | 350-400 trucks/day | Azerbaijan → Russia | Expansion agreement exists. Major northern route. INSTC road segment [9-06]. |
| Bazargan (vs Turkey) | Major border (volume unconfirmed) | Turkey | TIR green lane under discussion. European transit relay point [9-08]. |
| Parviz Khan (vs Iraq/KRG) | Transit 4.6M tons (11mo top) | Iraq (KRG/Sulaymaniyah) | Largest foreign cargo transit gate. Shows Iraq-route road volume [9-18]. |
| Bashmaq (vs Iraq/KRG) | Transit 2.7M tons (11mo) | Iraq (KRG) | Complements Parviz Khan for KRG routes [9-18]. |
| (Ref.) Maritime Total | 234.8M tons/yr | All | Top 5 road gates combined: <5% of maritime. Volumetric substitution impossible. |
The final row reveals the essence: the top 5 road borders combined amount to less than 5% of total maritime volume. Mehran’s ~2.4M tons/year is 3% of Shahid Rajaee’s 81M tons. Road routes ‘exist, but cannot substitute for maritime’ — this is what the numbers show.
6. Rail and INSTC — The ‘Strategic Corridor’ Ideal vs Incomplete Reality
Rail can carry larger volumes than road, theoretically substituting part of maritime. Iran’s rail freight is 32,920M ton-km (2021, World Bank) [9-04], with international transit reaching a record 5M+ tons in 2025 [9-05]. But this 5M tons is just 2.1% of port throughput of 234.8M tons. RailFreight notes 2026 replication is difficult [9-05] — sanctions turning ‘kinetic’ cause transit-country shippers/insurers/railways to recalculate risk.
INSTC (International North-South Transport Corridor) links India–Iran–Russia. But its core Rasht-Astara rail segment (Iran-Azerbaijan) remains incomplete [9-19]. Rasht-Caspian (37km) is open, but Rasht-Astara is under construction. Similarly, Chabahar-Zahedan is incomplete. Rail has strategic importance but currently carries only 2% of maritime volume, key sections are unfinished, and sanctions reduce replicability.
7. Air Freight — 390,000 Tons Covers Nothing
Air cargo at 391,889 tons (FY1403) [9-03] is 0.17% of port throughput of 234.8M tons. Air is essential for high-value/urgent cargo (pharmaceuticals, electronics) but cannot substitute bulk (food, construction, fuel). International flights face sanctions/restrictions and shrink further in wartime. Air is ‘supplementary,’ not ‘alternative.’
8. Summary of Part I — Maritime’s Overwhelming Dominance and Irreplaceability
The full-mode inventory yields a clear conclusion. Against maritime’s 234.8M tons, rail transit is 5M tons (2.1%), top 5 road borders total an estimated <10M tons (<4%), air is 390K tons (0.17%). All non-maritime modes combined amount to less than 7% of maritime.
9. Gas Pipelines — The ‘Sixth Access Mode’ Independent of Hormuz
Table 9-A: Iran’s Gas Pipeline Exports — Non-Hormuz Foreign Currency Source
| Pipeline | Destination | Commodity | Actual Volume | Key Notes |
| Iran→Turkey Pipeline | Turkey | Natural gas | 8.17 bcm (2025 actual) | Contract ceiling 9.6 bcm/yr (expires Jul 2026). Winter demand fluctuations. Iran is Turkey’s 3rd-largest gas supplier. Tehran Times [9-23]. |
| Iran→Iraq Gas Supply | Iraq | Natural gas | ~7.8 bcm (2024 actual) | Supports Iraq’s electricity demand. Payment terms politically contentious (arrears). Columbia SIPA analysis [9-24]. |
Combined ~16 bcm/year of gas pipeline exports are physically unaffected by Hormuz closure as a pipeline infrastructure matter. Whether Turkey/Iraq halt purchases in wartime depends on buyer-side supply-demand structures, not unilateral political decisions. Turkey’s ~8 bcm from Iran constitutes ~14% of Turkish gas imports (after Russia 42%, Azerbaijan 22%). Turkey’s domestic Black Sea Sakarya gas field produces only 3.3 bcm (2025) to 5 bcm (2026), with the 14.6 bcm target not achieved until 2028. In the Turkey–Iran gas contract’s final months (expires Jul 2026), cutting Iranian supply during winter peak demand would directly impact Turkish heating and industry. Turkey’s continued gas purchases from Russia post-Ukraine invasion demonstrates that energy security needs can override political pressure. Assessment: pipelines are unlikely to stop in the short term, physically or politically — making this essentially Iran’s only surviving large-scale foreign currency source under Hormuz closure.
10. Road Gate Supplements — Parviz Khan’s Distinctiveness and Pakistan/Afghanistan Borders
Table 9-B: Road Gate Ranking by Daily Traffic Volume (Supplemented Version)
| Gate | Province | Daily Traffic | Key Metric | Notes |
| Parviz Khan (vs Iraq) | Kurdistan | 690 trucks/day (export) | 45% of Iran-Iraq non-oil exports | Iran’s largest non-oil overland export gate. Iraq market lifeline [9-25]. |
| Mehran (vs Iraq) | Ilam | ~400 trucks/day | 2.2M tons / 11mo | Pilgrimage + trade combined. Zurbatiyah direction. |
| Astara (vs Azerbaijan) | Gilan | 350-400 trucks/day | INSTC western route node | INSTC entry to Azerbaijan → Russia. |
| Bazargan (vs Turkey) | West Azerbaijan | 60 trucks/day (capacity cap) | European route | Turkish receiving quota constraints. Waiting truck queues. |
| Bashmaq (vs Iraq/KRG) | Kurdistan | — | 2.7M tons / 11mo | Sulaymaniyah direction. Complements Parviz Khan. |
| Milak/Rimdan (vs Pakistan) | Sistan-Baluchestan | — (small) | Limited | Insecure area. Theoretical combo with Chabahar but practical constraints large. |
| Dogharoun (vs Afghanistan) | Razavi Khorasan | — (small) | Limited | Taliban-era instability. Central Asia overland. Effective access extremely limited. |
Parviz Khan leads in daily traffic volume. However, even all gates combined remain under 5% of maritime (234.8M tons/year).
11. Essential Import Hormuz Dependency — Not Just ‘Can’t Sell’ but ‘Can’t Receive’
Iran’s non-oil imports reach ~$72.4B and 39.3M tons (March 2025 period). Of this, grain (wheat, corn, etc.) alone is 14.9M tons (~38% of imports, $4.63B). OECD/FAO projects that even in 2028, imports of wheat 656K tons, rice 1.4M tons, corn 10.3M tons, soybeans 2.7M tons, and vegetable oil 1.7M tons remain essential. Corn at 10.3M tons is livestock/poultry feed — if this stops, meat/egg/dairy production collapses in cascade. Medical devices/pharmaceutical APIs at $2.78B and industrial base materials (plastics $4.25B, steel $3.67B) enter by sea. Most transit Imam Khomeini port (>48M tons/year) and Shahid Rajaee — both inside Hormuz.
Under Hormuz closure, not only exports stop but grain 14.9M tons/year, medical equipment $2.78B, industrial materials $7.9B+ of imports simultaneously cease. Alternative route capacity (road gates <5%, Chabahar <2%, rail 2%, air 0.17%) means emergency essential imports under Hormuz closure have a maximum capacity of 7-8% of peacetime maritime volume. FAO data shows Iran’s grain strategic reserves at 12.1M tons (wheat 8.8M tons) — ~8-9 months of wheat consumption. However, feed corn (10.3M tons annual import) has no comparable stockpile; within weeks of Hormuz closure, livestock/poultry feed supply ceases, triggering cascading collapse of meat/egg/dairy production. Physical material shortage may hit citizens before Chapter 8’s ‘3.7-month’ fiscal exhaustion — this is the specific mechanism of the ‘dual pressure’ of fiscal and material exhaustion.
12. Access Mode Weighting — Deriving Maritime 73 : Road 20 : Rail 7
Table 9-4: Access Mode Weight Derivation
| Mode | Actual Volume | Volume Share | Weight | Basis for Weight |
| Maritime | 234.8M tons/yr 3.08M TEU | 93%+ of all modes | 73 | Crude (103M tons) included, but crude partially substitutable via pipeline, so weight adjusted downward from volume share. All container/bulk/liquid cargo depends on maritime. |
| Road (Border Gates) | Est. 10-12M tons/yr (top 5 combined) | 4-5% of all modes | 20 | Volume <5% but strategic value as ‘last lifeline’ when maritime stops is disproportionate. Emergency food/medicine/fuel import via Iraq/Turkey/Azerbaijan. |
| Rail | 5M tons/yr (int’l transit) + 32,920M ton-km (domestic) | Transit = 2% | 7 | Reflects INSTC potential and mass-transport efficiency. But Rasht-Astara incomplete, sanctions reduce replicability. Current effectiveness limited. |
| Air | 390K tons/yr | 0.17% | (*) | Volumetrically negligible but essential for high-value cargo. Excluded from weighting; positioned as ‘supplementary mode.’ |
| Pipeline (Crude/Gas) | Gas: Turkey 9.6 bcm + Iraq 7.8 bcm Crude: Goreh-Jask actual <70K bpd | Energy-specialised | (*) | Dedicated energy infrastructure. Crude excluded to avoid double-counting with Kharg (maritime). Gas evaluated separately as diplomatic leverage. |
| TOTAL | 100 | Maritime 73 : Road 20 : Rail 7. Air and pipeline treated as supplementary/specialised. |
The critical judgment: road received a weight (20) far exceeding its volume share (<5%). This reflects strategic value as ‘last external connection’ when maritime stops. Mehran’s 400 trucks/day cannot substitute 234.8M tons, but as an emergency food/medicine import route, it is vitally important.
13. Bottleneck Analysis — Four Structural Vulnerabilities
Table 9-5: Four Structural Bottlenecks in Iran’s External Access
| Bottleneck | Quantitative Evidence | Structural Implication |
| ① Hyper-concentration on Hormuz/Southern Ports (SPOF) | Shahid Rajaee alone: 85-90% of containers, >34.5% of national volume, 22% of foreign trade [9-01]. Top 2 ports: >55%. Accident precedent: ‘57% halted’ [9-14]. | Single Point of Failure fully activated by Hormuz closure. The physical structure behind Chapter 8’s ‘tap shutoff.’ |
| ② Chabahar’s Alternative Insufficiency (Volume Limit) | Annual avg 1.5M tons, 22K TEU (annualized from 2018+ cumulative). <2% of Shahid Rajaee. Hinterland railway incomplete [9-02][9-17]. | ‘Hormuz bypass trump card’ doesn’t function volumetrically. Major expansion impossible without Chabahar-Zahedan railway completion. |
| ③ Road Border Processing Capacity Limit (Volume Deficit) | Top 5 borders combined: est. 10-12M tons/yr. <5% of maritime 234.8M tons. Each border: hundreds of trucks/day throughput [9-07][9-06]. | Road ‘exists but cannot substitute.’ Customs processing, security, partner-country systems are practical constraints. Also depends on political decisions by Turkey/Iraq/Azerbaijan. |
| ④ INSTC/Rail Incompleteness and Fragility | Rasht-Astara incomplete; INSTC strategically non-functional [9-19]. Chabahar-Zahedan incomplete. 2026 volume expected to decline under sanctions [9-05]. | Rail has ‘upside potential but can’t be used now.’ Incomplete sections can’t be accelerated in wartime. Sanctions reducing rail replicability. |
The most lethal bottleneck is ① (Hormuz/southern port hyper-concentration). When activated, ②③④ none can fill the gap. Iran’s ‘roads to the outside’ structurally lack redundancy.
14. Hormuz Closure Scenario — Economic Impact of 37 Vessels/Day → 0
Table 9-6: Estimated Economic Impact of Hormuz Closure
| Impact Area | Peacetime → Closure | Economic Impact | Basis and Notes |
| Crude Exports | 1.38-1.43M bpd → ~zero | Monthly $2.9-3.1B vanishes | Kharg-route 90% halted. Goreh-Jask <70K bpd can’t substitute [9-09][9-10]. Ch.8 Case B premise. |
| Petroleum Product Exports | 820K bpd → severe reduction | Monthly $1.0-1.5B equivalent lost | LPG etc. maritime export stops. Domestic refining continues but export halts. |
| Container Imports | 3.08M TEU/yr → catastrophic decline | Consumer goods/parts/intermediates severed | Shahid Rajaee handles 85-90% [9-01]. Nearly all stops under Hormuz closure. Chabahar <2%, cannot substitute. |
| Bulk Imports (Food/Materials) | Imam Khomeini essentials >15M tons/yr | Direct food security hit | Wheat/rice/feed/sugar imports halt. Road 400 trucks/day can’t volumetrically cover [9-15]. |
| Transit Cargo | 21.9M tons/yr → severe decline | Transit revenue loss + neighbour relations damage | Shahid Rajaee customs = largest transit hub [9-18]. Port-route transit stops; road transit disrupted. |
| GDP Impact (est.) | — | GDP ▼10-20% (at 6 months) | Crude export loss (GDP 15-20%) + trade contraction + industrial stagnation. IMF revenue/GDP 10.37% [9-21] severely damaged. |
| CPI Impact (Inflation) | — | +50-100% (annualized acceleration) | Import severance → supply shock → price explosion. Riyal already at historic low [9-22]. CB money printing accelerates. |
| Unemployment Impact | — | +10-20pp (additional unemployment) | Port/trade/oil industry employment directly hit. Shift to informal economy accelerates. |
Table 9-6 shows Hormuz closure is not merely ‘can’t sell crude.’ Container import devastation, bulk food severance, transit shutdown — all occur simultaneously. Chapter 8’s ‘~3.7 months of fiscal endurance’ focused on crude revenue loss; the import severance causing ‘real economy collapse’ hits citizens more directly, potentially before fiscal exhaustion.
15. Wartime ‘Last Lifelines’ — What Remains and What Gets Through
Table 9-7: Access Routes Surviving Hormuz Closure and Their Effectiveness
| Route | Effective Volume | Use | Effectiveness Assessment |
| Chabahar Port (Gulf of Oman) | 4.15M tons/yr (provincial ports) | Emergency food/materials import | Only major port not requiring Hormuz. But hinterland railway incomplete; mass inland transport difficult. India operates but sanctions risk emerges. Current volume <5% of Shahid Rajaee [9-02]. |
| Mehran Border (vs Iraq) | ~400 trucks/day ~2.4M tons/yr | Emergency road food/fuel import | Iraq route is politically most open. But 400 trucks/day processing capacity is <1% of port volume. Depends on Iraqi political/security conditions [9-07]. |
| Astara Border (vs Azerbaijan) | 350-400 trucks/day | Northern materials import | Azerbaijan route to Russia/CIS via INSTC road segment. Azerbaijan’s stance toward Iran may shift in wartime [9-06]. |
| Bazargan Border (vs Turkey) | (Volume unconfirmed) | European relay food procurement | Turkey (NATO member) border. Turkey’s wartime stance is the largest uncertainty [9-08]. |
| Caspian Ports (Amir-Abad etc.) | 5.04M tons/yr | Russia/CIS maritime connection | Direct maritime link to Russia via Caspian. Tonnage/port capacity limited but could become sanctions ‘loophole’ [9-16]. |
| Pipeline (Gas to Turkey) | Max 9.6 bcm/yr | Diplomatic leverage | Gas supply continuation directly tied to Turkey relationship maintenance. Contract expires Jul 2026 [9-11]. |
These ‘surviving routes’ combined total an estimated 15-20M tons/year — just 7-8% of peacetime maritime’s 234.8M tons. Moreover, this 7-8% is ‘maximum capacity’; wartime chaos, transit-country political decisions, and secondary sanctions effects further reduce effective throughput. Under Hormuz closure, Iran loses over 90% of its external connectivity. The remaining 7-8% can barely manage ‘minimum emergency food/medicine imports’ — insufficient for ‘normal economic operations.’
16. Strategic Implications — What ‘Road to the Outside’ Vulnerability Means
Three strategic implications emerge. First, Iran’s endurance is defined not only by military and fiscal factors but also by logistics vulnerability. Chapter 7’s military residual (~26%), Chapter 8’s fiscal coverage (~3.7 months), and this chapter’s ‘90%+ external access loss’ form the third constraint on Iran’s endurance. Military may hold, finances may hold, but if food can’t enter, society won’t hold.
Second, Iran’s external access vulnerability is ‘structural’ and won’t suddenly resolve in wartime. The 85-90% concentration on Shahid Rajaee, incomplete Chabahar hinterland railway, incomplete INSTC Rasht-Astara — all are peacetime structural problems. Wartime doesn’t allow sudden railway construction or port expansion.
Third, Hormuz closure ‘release’ rests in IRGC’s own hands, but the decision contradicts military logic. The same antinomy as Chapter 8’s ‘two-front pressure’: opening Hormuz restores food and currency but is interpreted as ‘capitulation.’ Keeping it closed preserves resistance posture but starves citizens. No resolution exists short of war’s end.
17. Chapter 9 Conclusion — Maritime 73 : Road 20 : Rail 7 Shows ‘Irreplaceability’
The actual-number inventory of Iran’s ‘roads to the outside’ confirms the following: Ports at 234.8M tons/year overwhelmingly dominate external access, with 85-90% concentrated at Shahid Rajaee, which cannot function without Hormuz transit. Chabahar averages 1.5M tons/year (<2% of Shahid Rajaee), Goreh-Jask actual <70K bpd. Top 5 road borders combined <5% of maritime, rail transit 2%, air 0.17%. All non-maritime modes combined amount to less than 7% of maritime.
Access mode weighting — Maritime 73 : Road 20 : Rail 7 — derives from this actual-number accumulation. Road received weight exceeding volume share, reflecting strategic value as ‘last lifeline’ when maritime is lost.
With Hormuz collapsed from 37 vessels/day to 0, Iran has lost over 90% of external connectivity. The remaining 7-8% barely sustains emergency imports; it cannot maintain normal economic operations. ‘If Hormuz stops, it’s bad’ translates, by the numbers, to ‘If Hormuz stops, Iran’s external connectivity virtually vanishes.’
Chapter 10 addresses this study’s final question: How did the CIA assess the ‘aftermath’? Integrating all chapters’ findings, it examines the structure of the ‘calculated gamble’ that issued the GO order while projecting an IRGC hardline successor as most likely.
Chapter 9 — References
[9-01] Iran International, “Shahid Rajaee Port” (>81M tons, foreign trade $29B=~22%, container 85-90% concentration) [Link]
[9-02] Reuters / India MEA, Chabahar Port (134,082 TEU cumulative, 8.7M tons cumulative, hinterland railway incomplete) [Link]
[9-03] IFP News, Iran Aviation Statistics (Air cargo 391,889 tons) [Link]
[9-04] World Bank / TradingEconomics, Iran Railways (32,920M ton-km, 2021)
[9-05] RailFreight, Iran Rail Freight 2025 (5M+ tons, 2026 replication difficult)
[9-06] CaspianPost, Astara Border (350-400 trucks/day) [Link]
[9-07] Rudaw, Mehran Border (2.2M tons/11mo, $1.2B, ~400 trucks/day)
[9-08] IRU, Iran Border Visits (Bazargan, TIR green lane) [Link]
[9-09] Reuters, Iran Energy Infrastructure (Kharg 90%, crude 3.3M bpd) [Link]
[9-10] EIA / NS Energy, Goreh-Jask Pipeline (Design 1M bpd, actual <70K bpd, ceased Sep 2024)
[9-11] Columbia CGEP / S&P Global, Iran Gas (Turkey 9.6 bcm/yr, expires Jul 2026) [Link]
[9-12] PortNews / Hellenic Shipping News (Ports 234.8M tons, 3.08M TEU) [Link]
[9-13] Container News, Iranian Ports 2024 (Shahid Rajaee 2.39M TEU)
[9-14] IranWire, Port Explosion Halts 57% of Maritime Capacity [Link]
[9-15] TINN, Imam Khomeini Port (>48M tons, essentials >15M tons)
[9-16] Tehran Times, Amir-Abad Port (5.04M tons) [Link]
[9-17] Maritime Executive, Chabahar-Zahedan Railway Delay
[9-18] Pars Today, Transit of 20 Million Tons (Parviz Khan 4.6M tons, Bashmaq 2.7M tons)
[9-19] Valdai Club, Rasht-Caspian Railway (Rasht-Astara incomplete)
[9-20] Reuters, Tanker Traffic Collapsed at Hormuz, 2026/03/06 (37 vessels/day → 0) [Link]
[9-21] IMF DataMapper, Iran Profile (Government revenue/GDP 10.37%)
[9-22] Reuters, Iran Currency Record Low, 2026/01/27 [Link]
[9-23] Tehran Times, Iran Gas Exports to Turkey (2025 actual 8.17 bcm, contract max 9.6 bcm/yr) [Link]
[9-24] Columbia SIPA, Iran Natural Gas Paradox (Iraq 7.8 bcm, domestic supply constraints) [Link] [9-25] IFP News, Parviz Khan Customs ($996M exports to Iraq, 45% of Iran-Iraq non-oil exports, 690 trucks/da
Leave a Reply