
Analysis baseline: approximately March 5, 2026. Events after this date are not reflected.
Chapter Index
| Chapter | Title |
| Prologue | What Happened on February 28, 2026 |
| Ch. 1 | The Path from Nuclear Talks to Military Action and the Structure of Justification |
| Ch. 2 | How Past Limited Retaliation Enabled the Decision to Assassinate the Supreme Leader |
| Ch. 3 | The 58-Day Force Redeployment from Venezuela to Iran |
| Ch. 4 | Post-Assassination Power Structure Revealed by Persian-Language Primary Sources |
| Ch. 5 | The Military Meaning of Five Simultaneous Kills and the Reality of Successor Placement |
| Ch. 6 | Six-Stage Evaluation of the Intelligence Process That Made the Assassination Possible |
| Ch. 7 | Quantifying Iran’s Remaining Military Capability by Region and Domain |
| Ch. 8 | Verifying Wartime Fiscal Sustainability from Iran’s Actual Government Budget Figures |
| Ch. 9 | Verifying All of Iran’s Access Routes Beyond Hormuz with Actual Data |
| Ch. 10 | The CIA’s Pre-Assessment and Five Scenarios for ‘After the Destruction’ |
| Epilogue | What This Attack Designed, What It Achieved, and What It Has Not |
Chapter 8: Verifying Wartime Fiscal Sustainability from Iran’s Actual Budget Figures
── Reading the Peacetime Deficit Structure and Hormuz Dependency from the Budget PDF’s Actual Numbers
1. ‘The Economy Is Struggling’ Has No Numbers — Why Start from the Budget PDF
‘Iran’s economy is struggling under sanctions’ — this phrase flooded global media in 2026. But what does ‘struggling’ specifically mean? How large is the monthly deficit? How long can reserves last? How does this change in wartime? No media outlet answered these questions with numbers.
The reason is simple: Iran’s fiscal structure is difficult to assess externally. Under sanctions, official statistics are distorted, off-budget activities (state-owned enterprises, IRGC economic networks, foundations) carry enormous weight, and multiple exchange rates coexist. However, one document provides reliable figures: the budget bill PDF submitted by the Iranian government to parliament [8-01]. This document presents the numbers the government itself told parliament: ‘this is our projected revenue, this is our spending, and this is how we fill the gap.’ It is an administrative document, not propaganda.
This chapter extracts revenue, expenditure, and financing structures line by line from the original FY1405 (March 2026–March 2027) budget bill PDF. Not from secondary sources like PressTV’s $261bn estimate [8-02] or WANA’s defence/security budget calculation of $9.23bn [8-03], but directly from the PDF’s Table 1 (National Budget Summary), Table 2 (Current Account), Table 3 (Capital Assets), and Table 4 (Financial Assets = Financing). This is the starting point for the fiscal analysis.
2. National Budget Summary (Table 1) — The 144.4 Trillion ‘Plumbing’ Overview
Table 1 (p.42) of the budget PDF is the summary of ‘revenue sources (inflow)’ and ‘expenditure uses (outflow)’ [8-01]. All amounts are in units of 100 riyals (multiply by 10 for new riyal equivalents). This single table reveals the entire ‘plumbing system’ of Iran’s finances.
Table 8-1: National Budget Summary (Table 1, p.42) — Revenue Sources and Expenditure Uses
| Item | Amount (bn × 100 riyals) | Notes |
| [REVENUE SIDE] | ||
| Current Revenue (tax + other) | 40,174 | Tax revenue is the largest pillar. Oil-related revenue is separately booked under capital assets. |
| Capital Asset Disposals (mainly resource revenue) | 6,006 | Includes 2,634 from oil/petroleum products. The government’s ‘oil take’ appears here. |
| Financial Asset Disposals (sukuk, NDF, etc.) | 6,020 | Islamic bond issuance + National Development Fund drawdown + borrowing. The ‘cushion’ filling the deficit. |
| Government General Revenue Total | 52,200 | Sum of the above three. |
| Earmarked Revenue + SOEs + Consolidation | 92,199 | SOEs/banks/government-affiliated commercial entities at 88,966 — larger than the general budget. |
| Deductions (double-counting adjustment) | -18,985 | Eliminates government↔SOE double entries. |
| NATIONAL BUDGET REVENUE TOTAL (FINAL) | 144,414 | Corresponds to PressTV’s ~$261bn estimate [8-02]. |
| [EXPENDITURE SIDE] | ||
| Current Expenditure (payroll + operations + interest + subsidies + social benefits) | 34,015 | Broken down in Table 2 analysis (below). |
| Capital Expenditure (investment) | 2,751 | Infrastructure/equipment investment. Small as % of GDP even in peacetime. |
| Financial Asset Acquisition (debt repayment) | 15,434 | Existing debt repayment + financial asset acquisition. View net against inflows. |
| Government General Expenditure Total | 52,200 | Matches revenue side (balanced budget on paper). |
| NATIONAL BUDGET EXPENDITURE TOTAL (FINAL) | 144,414 | Same as revenue total. |
The most critical structural insight from this table: SOEs/banks/government-affiliated commercial entities’ revenue (88,966bn) exceeds the general government budget (52,200bn). Iran’s national economy is only half visible from the general account alone. The IRGC economic network, NIOC, and various foundations form massive ‘off-budget’ financial flows. However, this chapter’s analysis focuses on ‘government cash flow’; off-budget analysis is out of scope.
3. Current Account Breakdown (Table 2) — Tax Revenue 29.6T, Social Benefits 16.0T, Deficit -6.2T
Table 2 (p.43) shows the breakdown of government current revenue and current expenditure [8-01]. This table determines the ‘peacetime deficit structure.’
Table 8-2: Current Revenue Breakdown (Table 2, Revenue Side)
| Category | Amount (bn × 100 riyals) | Notes |
| Tax Revenue (direct + indirect + customs) | 29,611 | 87% of current revenue. Al Jazeera reports +62% YoY target [8-04]. |
| State Property / Government Asset Income | 2,284 | SOE dividends, asset management returns, etc. |
| Goods & Services Sales Revenue | 833 | Government agency fees, service charges, etc. |
| Fines, Damages, etc. | 378 | Includes traffic violations etc. Wartime collection becomes difficult. |
| Miscellaneous Revenue | 910 | Other. |
| Social Insurance Contributions | 0 | Zero (processed in separate account). |
| CURRENT REVENUE TOTAL | 34,015 | This is the total ‘recurring revenue flowing into the government.’ |
Critically, oil export revenue is not directly included in ‘current revenue.’ Oil-related revenue is separately booked under Table 1’s ‘Capital Asset Disposals’ (6,006bn, of which 2,634bn from oil/petroleum products) [8-01]. Current revenue of 34T runs on ‘taxes and fees’; oil’s ‘government take’ enters through the capital account. Conversely, this means if oil revenue stops, a massive hole opens in the capital account side.
Table 8-3: Current Expenditure Breakdown (Table 2, Expenditure Side)
| Category | Amount (bn × 100 riyals) | Notes |
| Personnel Costs (staff compensation) | 10,196 | 25% of expenditure. Civil servant and military salaries. Difficult to cut in wartime. |
| Goods & Services Purchases | 2,804 | Government operating costs. |
| Interest Payments | 3,340 | Interest on existing debt. Non-reducible. |
| Subsidies | 1,775 | Fuel/food subsidies. Cutting triggers riot risk in wartime. |
| Grants (gratuitous transfers) | 321 | Includes foreign aid etc. |
| Social Benefits | 16,040 | 40% of expenditure. Pensions, welfare, living support. Wartime pressure increases. |
| Other Expenditure | 5,697 | May include portions of security/military spending. |
| CURRENT EXPENDITURE TOTAL | 40,174 | Exceeds current revenue of 34,015 by 6,159. This is the current account deficit. |
Note: Social benefits of 16,040 constitute 40% of expenditure. In wartime, inflation, unemployment, and rationing increase pressure, but cuts trigger social unrest. The current account (Operating Balance) is -6,159bn (in 100 riyal units) in deficit [8-01]. Converting to monthly: -513bn/month. This is ‘the hole Iran must fill every month in peacetime’ and the starting point for all calculations in this chapter.
4. Financing Structure (Tables 4/8) — The True Nature of the 9.4T Cushion
The current deficit of -6.2T is filled by the net value of Table 4 (financial asset disposals = financing inflows) and Table 8 (financial asset acquisitions = financing outflows = repayment) [8-01].
Table 8-4: Net Financing Calculation (Tables 4/8 Basis)
| Item | Amount (bn × 100 riyals) | Notes |
| Financing Inflows Total (Table 4) | 15,434 | Sukuk issuance 940bn + NDF drawdown 590bn + other borrowing/asset sales [8-01][8-02] |
| of which: Sukuk issuance | 940 | PressTV: ‘940bn new riyals in sukuk’ [8-02]. Assumes domestic market absorption. |
| of which: NDF drawdown | 590 | National Development Fund = intergenerational asset fund. Wartime drawdown damages long-term national foundations. |
| Financing Outflows Total (Table 8) | 6,020 | Existing debt repayment etc. Limited room for reduction. |
| Net Financing (Inflows − Outflows) | 9,414 | Annual basis. The ‘cushion’ covering the current deficit. |
| Cushion ÷ Monthly Deficit (−513) | ~18.3 months | ~1.5 years of coverage against peacetime monthly deficit. But wartime deficit expansion sharply reduces this. |
The ‘contents’ of the 9.4T cushion matter. Sukuk issuance of 940bn assumes domestic market absorption, but in wartime, inflation and currency anxiety reduce buyers. NDF drawdown of 590bn consumes a fund established as ‘reserves for the post-oil era,’ damageing future national foundations. The cushion itself is money that ‘hurts when spent’ — it is not an infinitely available ‘reserve.’
5. Hormuz Dependency — Kharg Island 90%, Goreh-Jask Actual: Under 70,000 bpd
That Iran’s crude exports depend on the Strait of Hormuz is widely known, but how extreme this dependency is can only be grasped through numbers.
According to Reuters, approximately 90% of Iranian crude is exported via Kharg Island through Hormuz [8-05]. Kharg Island sits inside the Persian Gulf and cannot reach open sea without transiting the Strait. Iran’s crude export infrastructure — pipelines, storage, loading facilities — has been built around Kharg over decades.
The Goreh-Jask pipeline, mentioned as a ‘Hormuz bypass,’ is designed to export directly from Jask port on the Gulf of Oman side, but its effectiveness is extremely limited. EIA data indicates a maximum design capacity of approximately 300,000 bpd [8-06]. Yet actual throughput in summer 2024 was under 70,000 bpd, and loadings ceased entirely from September 2024 [8-06]. Even at maximum capacity, the pipeline covers only 22% of China-bound exports of 1.38M bpd; on an actual basis, a mere 5%. ‘Goreh-Jask means Hormuz closure is manageable’ is a fantasy unsupported by data.
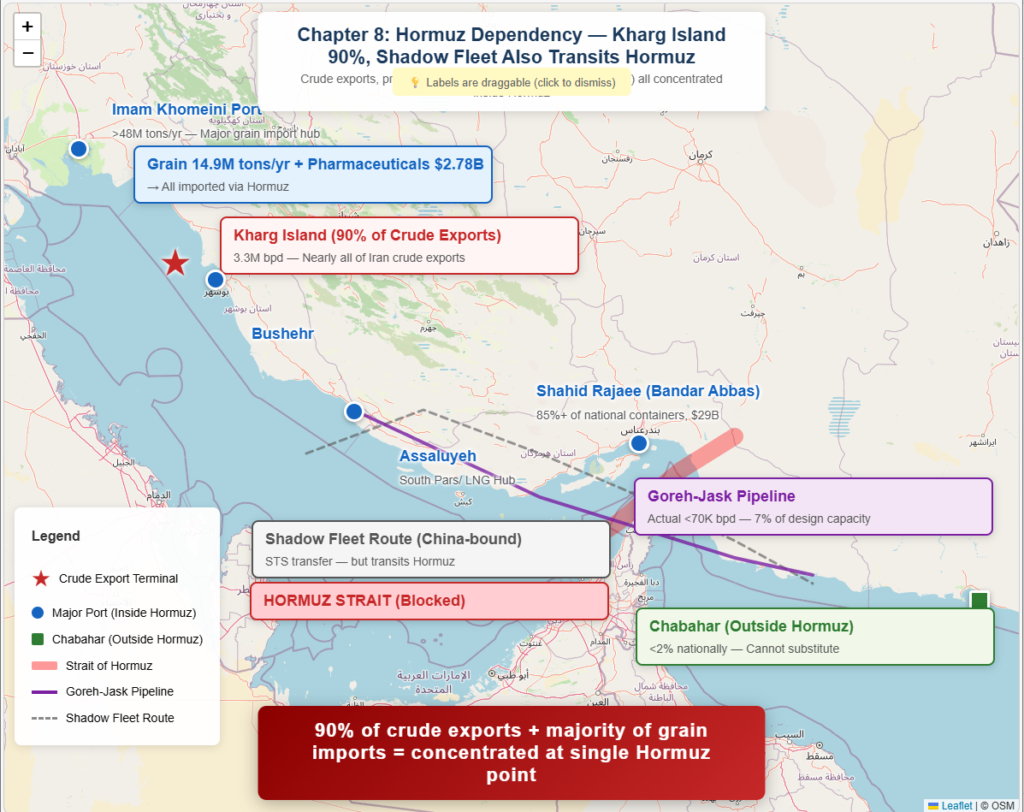
Figure 8-1: Hormuz Dependency — Kharg Island 90%, Shadow Fleet Also Transits Hormuz
Source: Author. Map tiles: © OpenStreetMap contributors (ODbL). Crude exports: EIA ‘Strait of Hormuz Transit.’ Port data: Iran PMO Annual Report, Tehran Times. Shadow fleet: Reuters (2026/01/13). Goreh-Jask: BOE Report / NS Energy. Grain imports: FAO / Tehran Times.
6. The ‘Shadow Fleet’ Also Transits Hormuz — Physical Vulnerability of Sanctions-Evasion Flows
The ‘shadow fleet’ sustaining Iran’s crude exports — ship-to-ship (STS) transfers, flag switching, AIS transponder blackouts — has been the ‘thin lifeline’ for Iran’s foreign currency earnings under sanctions [8-05]. The largest buyer is China, with Kpler estimating 1.38M bpd in 2025 at a sanctions discount of $8-10 below Brent [8-07]. Vortexa estimates 1.43M bpd for January-August 2025, with pre-crisis rush loading reportedly reaching 2.15M bpd in February 2026 [8-08].
However, this shadow fleet has a structural weakness: all flows physically transit the Strait of Hormuz. Offshore transfers and flag switching occur after tankers pass through Hormuz. With IRGC broadcasting ‘transit prohibited’ via VHF and tanker traffic collapsing from 37 vessels/day to zero [8-09], shadow and regular fleets alike are stopped. The sanctions-evasion ‘thin lifeline’ has been severed by Hormuz’s physical closure.
Moreover, even without physical closure, insurance cancellation alone creates de facto closure. Reuters reports that war risk premium surges and insurance cancellations have left numerous tankers stranded or immobilised [8-10]. Shipowners refuse to sail uninsured; insurers refuse to cover war zones. When this ‘insurance chain’ breaks, a ‘de facto closure’ emerges even without physical blockade. The BBC described this mechanism as ‘the threat alone makes transit impossible’ [8-11].
7. Quantifying Monthly Crude Flows — What Vanishes When the ‘Tap’ Is Shut Off
Table 8-5: Iran’s Monthly Crude Flow Calculation (Peacetime Baseline)
| Item | Value | Notes |
| Export Volume (China-centric) | 1.38–1.43M bpd (annual avg) [8-07][8-08] | China >80%. Pre-crisis rush: 2.15M bpd in Feb [8-08]. |
| Realized Price | Brent −$8–10 (sanctions discount) [8-07] | At Brent=$80/bbl, realized price ~$70–72/bbl. |
| Monthly Crude Revenue (est.) | $2.9–3.1bn/month | 1.38M bpd × 30d × $71/bbl = $2.94bn. Upper: 1.43M × $72 = $3.09bn. |
| Annual Crude Revenue (est.) | $35–37bn/year | BBC’s FY oil revenue of $67bn includes petroleum products. Crude-only at this level. |
| Petroleum Product Exports | ~820,000 bpd (LPG etc.) [8-05] | Additional FX source beyond crude. Also Hormuz-dependent. |
| Loss Under Hormuz Closure | Monthly $2.9–3.1bn crude + products | Even max Goreh-Jask operation yields only $300–400M/mo. ~90% vanishes. |
The meaning of monthly crude revenue approaching zero must be translated into Iran’s national budget. In the budget PDF, the oil-related ‘government take’ is booked as capital asset disposals at 2,634bn/year (100 riyal units) [8-01]. At 1 USD = 130 new riyals, this equals ~$20.3bn/year, or ~$1.7bn/month. This figure is ‘the portion entering the general government account’ and excludes flows via NIOC or funds. For government cash flow, the disappearance of this $1.7bn/month is the direct impact.
Additionally, Hormuz closure indirectly impacts tax revenue. The oil industry value chain (transport, refining, related services) is part of domestic economic activity; when it stops, related taxes (VAT, corporate tax, customs) also shrink. The World Bank estimates that ‘disposal of non-financial assets’ (oil etc.) accounts for ~30% of Iranian government revenue, with the remaining 70% being taxes and other sources [8-12] — but the latter also correlates with oil economy performance. Hormuz closure doesn’t just ‘shut off the tap’; it ‘degrades the entire pipe system connected to the tap.’
8. The Size of the ‘Hole’ and the Limits of the ‘Cushion’
Summarizing the numbers established so far: First, peacetime monthly deficit is -513bn (100 riyal units), covered by net financing of 9.4T for ~18 months. Second, tax revenue of 29.6T constitutes 87% of current revenue, and social benefits of 16.0T constitute 40% of current expenditure. Third, oil revenue is booked in the capital account at 2.6T/year (government take); Hormuz closure eliminates nearly all of this. Fourth, all export flows including the shadow fleet physically transit Hormuz, and Goreh-Jask’s substitute capacity is 5% on an actual basis.
Based on these numbers, three wartime scenarios (Case C mild / Case A moderate / Case B severe = baseline) calculate monthly deficit and coverage months. The following sections also examine the structural limits of RMB settlement, OFAC sanctions tactics, and post-exhaustion survival mechanisms and their side effects.
9. What the Budget PDF’s ‘Full Picture’ Reveals — Structural Vulnerabilities from Scanning All 13 Tables
Sections 2–7 extracted numbers from Table 1 (summary), Table 2 (current account), Table 3 (capital assets), Table 4 (financial assets), and Table 8 (financial asset acquisition). But the budget PDF contains 13+ tables in total, and assessing wartime fiscal vulnerability requires understanding not just the 5 tables analysed, but what the remaining tables reveal [8-01].
Table 8-A: FY1405 Budget PDF Full Table Navigation — 5 Analysed Tables and Remaining Structure
| Table # | Page | Content | Used in Ch8 | Wartime Implication |
| 1 | p.42 | National budget summary (sources & uses) | ✓ Sec.2 | Revenue 144.4T, expenditure framework. Starting point for this chapter. |
| 2 | p.43 | Government current revenue/expenditure | ✓ Sec.3 | Tax 29.6T, social benefits 16.0T, deficit -6.2T. ‘Peacetime deficit structure.’ |
| 3 | p.44 | Capital asset disposals/acquisitions | ✓ Sec.4 | Oil/petroleum-derived 2,634bn. ‘Oil government take’ in capital account. |
| 4 | p.45 | Financial asset disposals/acquisitions | ✓ Sec.4 | Sukuk 940bn, NDF 590bn. True nature of the ‘9.4T cushion.’ |
| 5 | p.46 | Revenue by sector/category/item detail | — | Tax category breakdown (VAT, corporate, income, customs). Needed for wartime tax collapse risk. |
| 6 | p.85 | Current + capital expenditure by chapter | — | Expenditure department structure. Which ‘chapter’ defence/security is allocated to. |
| 7 | p.100 | Major agency budgets (by programme) | — | Agency-level spending. IRGC/intelligence ministry allocations not transparently shown. |
| 8 | p.231 | Financial asset acquisition (= repayment) | ✓ Sec.4 | Net with Table 4 yields 9.4T cushion. |
| 9 | p.234 | Miscellaneous budget items | — | Meta-level budget allocations. |
| 10 | p.244 | Provincial: sources and expenditure | — | Local fiscal structure. Centre-province relations. |
| 11 | p.252 | SOEs/banks/government commercial entities | — | SOE revenue/expenditure summary. The largest ‘invisible fiscal’ layer. |
| 14 | p.256 | Subsidy rationalisation scheme | — | Subsidy targeting. Related to 572bn savings. |
| 16 | p.260 | Revenue tariffs/customs/tax rate schedule | — | Legal basis for tax rates. Exchange rate manipulation affects effective rates. |
9-1. The +62% Tax Revenue Target’s Wartime Collapse — ‘Budget Written But Revenue Won’t Come’
As Al Jazeera reported, the FY1405 budget books tax revenue at +62% YoY [8-04]. This partly reflects a rebound from low prior-year collections, but is undeniably an aggressive target.
In wartime, this target collapses. VAT correlates with consumption, which contracts in wartime. Corporate tax correlates with profits, which evaporate. Customs correlates with imports, which plummet under Hormuz closure. Table 5 (p.46) shows that most tax revenue comprises these business-cycle-sensitive categories [8-01]. The wartime chain: oil stops → economy contracts → VAT/corporate tax/customs fall → revenue drops not +62% but YoY negative. This cascade further worsens Case B’s monthly deficit of -2,518bn.
9-2. Multiple Exchange Rate Regime — How to ‘Read’ Budget PDF Numbers
A fundamental caveat in reading budget PDF numbers: Iran operates multiple parallel exchange rates. The official CBI rate, NIMA (non-oil export), SANA (import), and black market rates all coexist with large divergences [8-04]. Budget PDF figures are denominated in 100 riyal units based on the official or ‘budget exchange rate.’ But actual economic activity operates near the black market rate. In late 2025–early 2026, the riyal sank to historic lows on the black market with very high inflation [8-04].
This divergence means budget PDF numbers are nominal (riyal-denominated) and diverge significantly from real (dollar-denominated) values. The government can engineer nominal ‘revenue growth’ (riyal depreciation inflates the riyal value of the same dollar amount of oil revenue). But import prices also inflate in riyal terms, creating ‘revenue grew but buying power shrank.’ Wartime accelerates this: riyal collapse → nominal revenue temporarily inflates → import costs explode → real fiscal capacity shrinks.
9-3. Hormuz Dependency for Food and Essential Imports — The Dual Pressure of ‘Fiscal Exhaustion’ and ‘Material Exhaustion’
Section 5 described the ‘tap shutting off’ in terms of crude export cessation. But Hormuz closure stops imports too, not just exports. As Chapter 9 will verify, Iran’s maritime trade is 234.8M tons/year, with Shahid Rajaee port alone handling over 34.5%. All major ports sit inside Hormuz.
Iran depends on imports for a significant portion of its food supply — wheat, cooking oil, animal feed, pharmaceutical raw materials arrive by sea. Under Hormuz closure, fiscal exhaustion (can’t sell oil) and material exhaustion (food/medicine can’t enter) progress simultaneously. This is ‘no money’ and ‘no goods’ pressuring citizens on two fronts. As Chapter 9 will quantify, all non-maritime modes (road, rail, air) amount to under 7% of maritime volume. Chabahar is outside Hormuz but handles under 2% nationally. Emergency food/essential imports must be sustained through just 7% of maritime capacity under Hormuz closure.
9-4. State-Owned Enterprises (SOEs) — The ‘Invisible Layer’ of the Budget
Table 11 (p.252) of the budget PDF summarises SOE/bank/government commercial entity revenues and expenditures [8-01]. This is a separate accounting layer from Table 1’s ‘national budget,’ constituting ‘hidden finances’ not appearing in the direct government budget.
If wartime stops these SOEs’ revenue (crude export cessation → NIOC revenue vanishes), SOE employee wages and operating costs shift onto the government’s fiscal burden. This hidden burden, not booked in Table 1’s ‘expenditure,’ further expands the actual wartime monthly deficit. Including SOE fiscal collapse, actual coverage months may be shorter than Case B’s ~3.7 months. Data constraints prevent quantification, but readers should note that ‘3.7 months’ is an upper bound, not a lower bound.
10. ‘Selling’ and ‘Collecting’ Are Different Problems — Structural Limits of RMB Settlement
As established, China-bound exports exceed 80% of Iran’s crude [8-07]. Under this structure, we must examine: ‘even if crude sells, how is payment received and how can it be used?’
Per CSIS analysis, SWIFT is a ‘messageing system,’ not a clearing institution that moves funds [8-13]. Therefore ‘the US controls SWIFT so all payments stop instantly’ is inaccurate. China has CIPS (Cross-Border Interbank Payment System) for RMB clearing, but Reuters reports CIPS ‘still heavily depends on SWIFT for messageing’ and ‘transition takes time’ [8-14]. CSIS also notes ‘CIPS is developing and limited in scale/participants compared to CHIPS’ [8-13].
Reconstructing the practical settlement flow: Chinese refineries/traders (including independents) pay in RMB; Iran receives in onshore RMB accounts in China. This RMB ‘can purchase goods/construction/bonds from China’ but capital controls and limited international acceptance make it difficult to use as ‘freely convertible foreign currency’ [8-13]. Crude sales yield RMB, but that RMB only buys ‘what China is willing to sell.’
What can’t Iran procure from China? Military precision components (Western-standard bearings, semiconductors, optics), some pharmaceuticals (patented drugs, advanced biologics), certain food items — and most critically, items where China itself bears secondary sanctions risk. Supplying dual-use technology or missile components to Iran carries US secondary sanctions risk for Chinese firms. China buying Iran’s crude and China selling militarily convertible technology to Iran involve entirely different risk calculations.
11. OFAC’s Sanctions Tactics — Not ‘Stopping’ but ‘Shaving’
The US Treasury’s OFAC Iran sanctions do not aim to ‘completely stop Iran’s foreign currency earnings.’ The aim is to raise transaction costs, shave per-barrel proceeds, and restrict usage [8-15]. This ‘shaving’ tactic operates through three channels.
First, sanctioning buyers to raise transaction costs. OFAC designates Chinese independent refineries (teapot refineries) by name, signalling willingness to hit ‘buyers, shippers, and intermediaries’ alike [8-15]. Transactions continue, but counterparties demand ‘sanctions-risk-inclusive discounts and fees,’ reducing Iran’s take. The $8-10/bbl sanctions discount is partly explained by this mechanism.
Second, catching funds the moment they touch the dollar system. OFAC seizes and freezes proceeds when Iranian crude payments transit the US financial system through laundering [8-15]. Iran must construct settlement routes that ‘completely avoid the dollar system,’ and the costs (fees, delays, adverse rates) are all deducted from Iran’s take.
Third, attacking the shadow fleet to raise logistics costs. OFAC continues sanctioning shadow fleet front company networks, explicitly targeting ‘cost increase → take reduction.’ OFAC press releases specify the intent of ‘reducing the revenue Iran receives for each barrel’ [8-16]. The result: not ‘can’t settle’ but ‘settlement goes through but collection is slow, diminished, and usage-restricted.’ This is the true nature of the ‘friction system’ OFAC has constructed.
12. Procurement Feasibility — Not a Money Problem but a Supplier Risk Calculation
‘If you have money you can procure’ — this premise does not hold for Iran. Procurement feasibility is determined not by ‘money’ but by ‘supplier sanctions risk.’
Civilian/general industrial procurement (food, consumer goods, construction materials, general machinery) has ‘room to work’ through Chinese sourcing [8-13]. Given RMB settlement via CIPS and Iran’s export concentration toward China, goods purchasable from China face high friction but not necessarily ‘complete stoppage.’ However, in wartime, Reuters reports insurance cancellation, war risk premium surges, and navigation disruption cause shipping costs and lead times to explode [8-10]. Materials ‘can be bought but won’t arrive / arrive at vastly inflated cost.’
Military/dual-use procurement is far more difficult. If a Chinese firm is identified as ‘supplying precision components or missile-related technology to Iran,’ it faces US secondary sanctions. Whether the Chinese government tolerates this risk depends on China’s own cost calculation in US relations — not something Iran can unilaterally expect. As a result, precision components for military-industrial rebuilding are structurally difficult to procure regardless of available funds. The ‘inventory exists but can’t fire’ state verified in Chapter 7 cannot be repaired because the ‘parts’ are unobtainable — this is the problem at the intersection of fiscal and military domains.
13. Three Wartime Scenarios in Detail — Assumptions and Sensitivity Analysis
The peacetime baseline established earlier (monthly deficit -513bn, net financing 9.4T, oil government take 2.6T/year) now receives wartime revenue reductions and expenditure increases. Assumption rates are shown below with their bases, so readers can adjust scenarios themselves.
Table 8-6: Three Scenario Assumptions (Rate Definitions and Bases)
| Assumption | Case C (Mild) | Case A (Moderate) | Case B (Severe = Baseline) |
| [REVENUE SIDE] | |||
| Oil/commodity-linked gov’t revenue decline | ▼10–20% | ▼30–60% | ▼70–90% |
| Basis | Hormuz intermittent transit. Price rise partially offsets volume drop [8-05] | Insurance cancellation evacuates most vessels. China-bound flow thins [8-10] | Hormuz de facto closure. 37 vessels/day → 0. Shadow fleet also stopped [8-09] |
| Tax revenue (est. 40% commodity-linked) decline | ▼5–10% | ▼20–30% | ▼30–40% |
| Basis | Partial port/customs/oil value chain halt | Export decline → domestic demand contraction → VAT/corporate tax hit | Broad economic contraction. Customs nearly zero. |
| [EXPENDITURE SIDE] | |||
| Defence/security spending increase | +30–50% | +50–80% | +80–100% |
| Basis | Standoff-centric. Reserve drawdown [8-03] | Full mobilisation begins. Equipment attrition replacement. | Full mobilisation + rationing + suppression costs. SIPRI $7.9bn base [8-17] |
| Social benefits + subsidies increase | +5% | +10% | +15% |
| Basis | Early inflation. Limited rationing. | Food/fuel subsidy expansion. Unemployment measures [8-02]. | Command economy. Currency collapse accelerates inflation [8-18]. |
Table 8-7: Three Scenario Results — Monthly Deficit and Coverage Months
| Scenario | Revenue Change | Expenditure Change | Monthly Deficit | Coverage Months (9.4T ÷ monthly deficit) |
| Peacetime (ref.) | No change | No change | -513bn/mo | 18.3 months |
| Case C (Mild) | Rev. ▼10–20%, Tax ▼5–10% | Defence +30–50%, Social +5% | -1,167bn/mo (2.3× peacetime) | ~8.1 months |
| Case A (Moderate) | Rev. ▼30–60%, Tax ▼20–30% | Defence +50–80%, Social +10% | -1,551bn/mo (3.0× peacetime) | ~6.1 months |
| Case B (Severe) = BASELINE | Rev. ▼70–90%, Tax ▼30–40% | Defence +80–100%, Social +15% | -2,518bn/mo (4.9× peacetime) | ~3.7 months |
Case B (baseline) monthly deficit of -2,518bn is ~5× peacetime, and net financing coverage collapses to approximately 3.7 months. This means ‘from the 4th month, cash flow heads toward exhaustion.’
Why Case B is the ‘baseline’: Hormuz Strait tanker traffic has collapsed from 37 vessels/day to zero [8-09], IRGC continues broadcasting ‘transit prohibited’ via VHF [8-09], and insurance cancellation plus war risk premium surges have halted tanker owners, majors, and traders from Hormuz-route crude/fuel/LNG transport [8-10]. Scenarios where this is ‘temporary’ (Cases C/A) are theoretically possible, but with attacks continuing and no sign of IRGC opening the strait, Case B is the highest-probability baseline.
14. Post-Exhaustion Survival — The State Doesn’t Stop, but Citizens Are Ground Down
After net financing exhausts at ~3.7 months, what does the Iranian government do? History provides answers. Iran has experienced fiscal crises under sanctions/war before (Iran-Iraq War 1980-88, 2018 Trump sanctions reimposition inflation crisis), and the regime ‘endured.’ But the mechanism of ‘enduring’ is extending the state’s life by grinding down citizens’ real living standards.
Table 8-8: Four Post-Exhaustion Survival Mechanisms and Their Side Effects
| Mechanism | Content | Side Effects and Limits |
| Central Bank Money Printing | Deficits unfilled by sukuk/NDF/borrowing are absorbed by the central bank, increasing money supply. Effectively ‘inflation tax.’ | Rapid inflation acceleration. Riyal already at historic lows vs. dollar [8-18]. Under high inflation, nominal tax revenue ‘grows’ but real tax revenue shrinks. Citizens’ riyal savings evaporate; flight to dollars/gold accelerates. |
| Subsidy Cuts + FX Preference Elimination | PressTV mentions potential savings of up to 572bn new riyals [8-02]. Unifying official/market exchange rates also under consideration. | Food/fuel price spikes → social unrest → suppression cost increases → fiscal deterioration spiral. Dec 2025 large-scale protests arose from exactly this dynamic. Al Jazeera described the gap as a ‘tough road ahead’ [8-04]. |
| Rationing / Command Economy | Food/fuel ration cards, price controls, export/import restrictions. ‘Wartime regime’ also used during Iran-Iraq War. | Short-term social stabilisation, but medium-term black markets, corruption, productivity decline. If rationing ‘fairness’ breaks (IRGC-linked preferential treatment etc.), public anger focuses on the IRGC. |
| Accelerated NDF Drawdown | Additional drawdown beyond budgeted 590bn. NDF balance per IFMF data is $100bn+ scale, but largely illiquid assets (oil-related FX investments). | NDF is an intergenerational fund for ‘post-oil Iran.’ Wartime consumption damages future national foundations. Full drawdown buys only months of survival — ‘consuming the future.’ |
All four survival mechanisms share a common structure: ‘before fiscal collapse, inflation, living costs, and security costs become the binding constraint.’ SIPRI data puts Iran’s military expenditure at $7.9bn, but in high-inflation environments, dollar-denominated figures appear deceptively small [8-17]. Domestic resource mobilisation (riyal-denominated payroll, materials procurement) ‘works via printing,’ but the cost is transferred to citizens as inflation.
Iran’s ‘fiscal endurance’ doesn’t end at ‘3.7 months’ on paper. The question is how much the regime is ground down during the ‘survival period’ after 3.7 months, determined by interaction with military pressure (Chapter 7) and logistics disruption (Chapter 9).
15. ‘Two-Front Pressure’ — The Intersection of Military Decay and Fiscal Decay
The military capability residual verified in Chapter 7 (overall ~26%, missile launch capability 25%, air defence 20%) and the fiscal endurance verified in this chapter (baseline ~3.7 months) constitute the ‘two-front pressure’ Iran faces.
Militarily, launch rates decline daily, and TEL/C2 degradation creates ‘inventory exists but can’t fire.’ Fiscally, Hormuz closure stops crude revenue, and within 4 months normal financing is exhausted. These two pressures mutually amplify. Military rebuilding requires funds, but finances are heading toward exhaustion. Extending fiscal life requires resuming exports, but the strait is blocked by IRGC itself. This structure — ‘the tap you shut yourself, you can’t reopen yourself’ — is the core of Iran’s dilemma.
For IRGC to ‘open’ Hormuz, some form of ceasefire agreement with the US/Israel is needed. But as Chapter 5 verified, new IRGC Commander Vahidi embodies the ‘external hardline’ direction, and ‘opening Hormuz to negotiate’ contradicts the foundation of his legitimacy. Military logic blocks economic survival; economic exhaustion makes military sustainment impossible — this antinomy defines the limits of Iran’s endurance.
16. Chapter 8 Conclusion — ‘Endurance’ Is Defined by Numbers
Translating ‘Iran’s economy is struggling’ into numbers yields the following picture:
Peacetime monthly deficit is -513bn (100 riyal units), covered by net financing of 9.4T for ~18 months. But under the baseline scenario (Hormuz de facto closure + full mobilisation), the monthly deficit inflates to ~5× peacetime, and coverage collapses to approximately 3.7 months.
After these ~4 months, Iran transitions to survival via money printing, subsidy cuts, rationing, and NDF drawdown. The state doesn’t stop, but citizens’ real living standards are rapidly ground down. Even if crude sells, RMB-denominated proceeds are structurally limited in ‘usability,’ and procurement of precision components for military-industrial rebuilding is structurally impossible regardless of funds.
The two curves of military decay (Chapter 7: overall ~26%) and fiscal decay (this chapter: coverage ~3.7 months) intersecting — that is the point that defines Iran’s ‘endurance limit’ in numbers. Chapter 9 examines the full picture of Iran’s ‘roads to the outside’ including the Hormuz Strait that is shutting off this fiscal ‘tap.’
Chapter 8 — References
[8-01] Iranian National Budget PDF (FY1405), Table 1 (p.42) / Table 2 (p.43) / Table 3 (p.44) / Table 4 (p.45) / Table 8 (Revenue, expenditure, and financing figures)
[8-02] PressTV, “Iran Government Draft Budget Proposal for Year 1405,” 2025/12/23 ($261bn estimate, sukuk 940bn, NDF, 1USD=130 new riyals) [Link]
[8-03] WANA, “14.5% Increase in Iran’s Defence and Security Budget for 1405” (Defence/security $9.23bn)
[8-04] Al Jazeera, “Iran’s Government Budget Reveals Tough Road Ahead,” 2025/12/26 (Tax +62% YoY, multiple FX rates, currency historic low) [Link]
[8-05] Reuters, “An Overview of Iran’s Energy Industry Infrastructure,” 2026/02/28 (Kharg 90%, crude 3.3M bpd + condensate 1.3M, products 820K bpd, shadow fleet structure) [Link]
[8-06] EIA, “Today in Energy: Strait of Hormuz Transit and Iran’s Goreh-Jask Pipeline” (Design 300K bpd, actual <70K bpd, ceased Sep 2024)
[8-07] Reuters, “China’s Heavy Reliance on Iranian Oil Imports,” 2026/01/13 (China >80%, 2025 avg 1.38M bpd, Brent -$8-10 discount) [Link]
[8-08] Reuters, “Discounts on Iranian Oil Widen in China,” 2025/09/16 (Vortexa 1.43M bpd); Reuters, “China Oil Refiners Cushioned,” 2026/03/02 (Feb rush 2.15M bpd) [Link]
[8-09] Reuters, “Iran War: See How Tanker Traffic Collapsed at Strait of Hormuz,” 2026/03/06 (37 vessels/day → 0) [Link]
[8-10] Reuters, “Iran Conflict Disrupts Global Shipping; Tankers Are Stranded, Damaged,” 2026/03/02 (Insurance cancellation, war risk premium, navigation halt) [Link]
[8-11] BBC, “Iran: What Does Conflict Mean for Oil, Shipping and Economy” (Hormuz 20M bpd, ‘threat alone makes transit impossible’) [Link]
[8-12] World Bank, “Iran Economic Monitor” (Revenue structure, non-financial asset disposal ~30%, Budget Law breakdown)
[8-13] CSIS, “Sanctions, SWIFT, and China’s Cross-Border Interbank Payments System” (SWIFT = messageing, CIPS developing, RMB usage limits) [Link]
[8-14] Reuters, “What Is China’s Onshore Yuan Clearing and Settlement System CIPS” (CIPS SWIFT dependency, transition difficulty) [Link]
[8-15] OFAC / US Treasury, Press Release sb0090 (Chinese teapot refinery sanctions, ‘shave per-barrel revenue’ tactic)
[8-16] OFAC / US Treasury, Press Release sb0322 (Shadow fleet / front company sanctions)
[8-17] SIPRI, “Trends in World Military Expenditure 2024” (Iran $7.9bn, note high-inflation dollar conversion) [Link]
[8-18] Reuters, “Iran’s Currency Drops to Record Low Against Dollar,” 2026/01/27 (Riyal historic low) [Link]
Leave a Reply